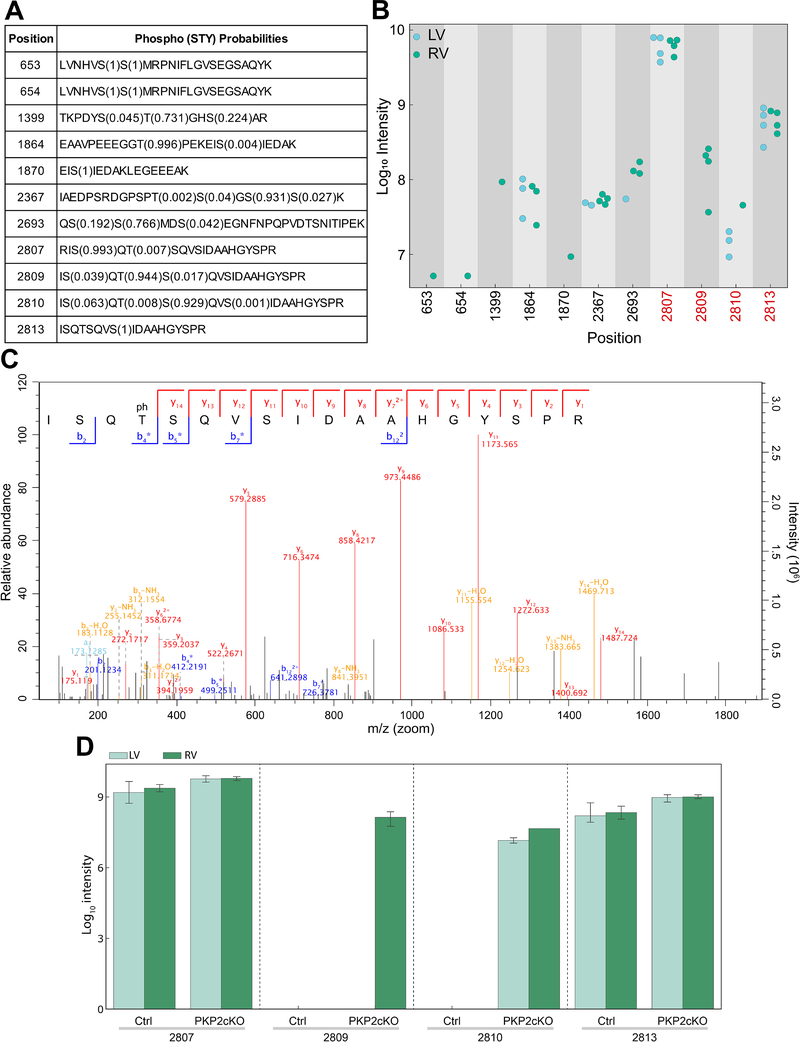
Figure 4. Mass spectrometry-based investigation of RyR2 phosphorylation state in LV versus RV of PKP2cKO hearts.
A: Summary of the eleven class-1 phosphopeptides identified. The first column indicates the position of the phosphorylated amino acid in the ryanodine receptor 2 (RyR2) sequence and the second column, the amino acid sequence of the peptide in which the phosphorylation site was measured. The numbers in brackets indicate the probability with which the localization of the phosphorylation site has been assigned to that particular residue (assignment of phosphorylation site localization depends on fragmentation pattern). B: Mass spectrometry-based intensity measurements of phosphopeptides covering the eleven phosphorylation sites. Intensities of all measured phosphopeptides are displayed. Measurements from right ventricle (RV) samples are depicted in green and measurements from left ventricle (LV) samples, in blue. The phosphorylation ‘hot spot’ of RyR2 is highlighted in red. Phosphorylation of site 2809 was exclusively identified in RV samples. C: Measured peptide covering T2809 is shown along with the detected fragment ions indicated. The fragment ions are highlighted in the tandem mass spectrometry (MS/MS) spectrum. The peptide contained one phosphate group, and due to the fragmentation pattern the phosphorylation site could be localized to threonine 2809. D: Data summary. Mass-spectrometry based intensity measurements of phosphopeptides covering the four phosphorylation sites in the “hotspot” region of RyR2 from tissue samples control (Ctrl) and plakophilin-2 conditional knockout (PKP2cKO) mice. Measurements from LV and RV samples depicted in light and dark green, respectively. n=3 for control samples and 4 for PKP2cKO samples.

