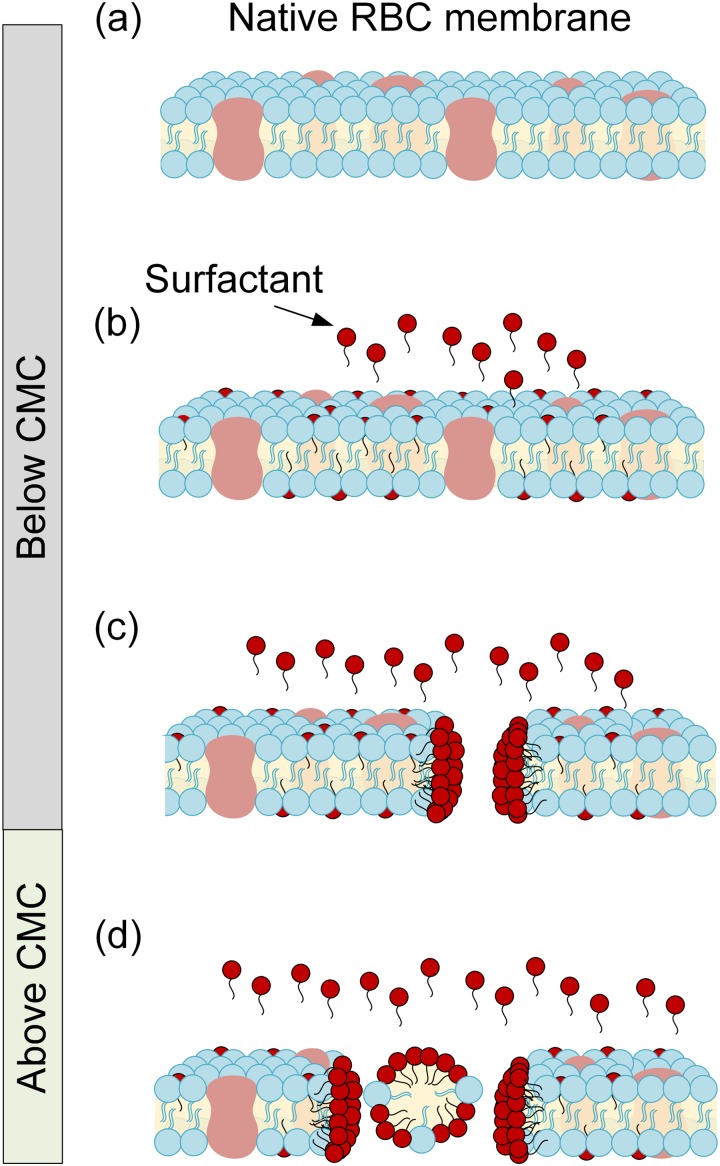
FIG. 1.
Schematic of interaction between a red blood cell (RBC) membrane and surfactant molecules at concentrations below and above the critical micelle concentration (CMC). (a) Native RBC membrane schematic in the absence of surfactants. (b) Surfactant molecule intercalation within the RBC membrane, below CMC. (c) Pore formation within the RBC membrane as the surfactant concentration approaches the CMC. (d) Surfactant solubilization of the cell membrane yielding hemolysis above the CMC. The cartoon was adapted from a previous study.28

