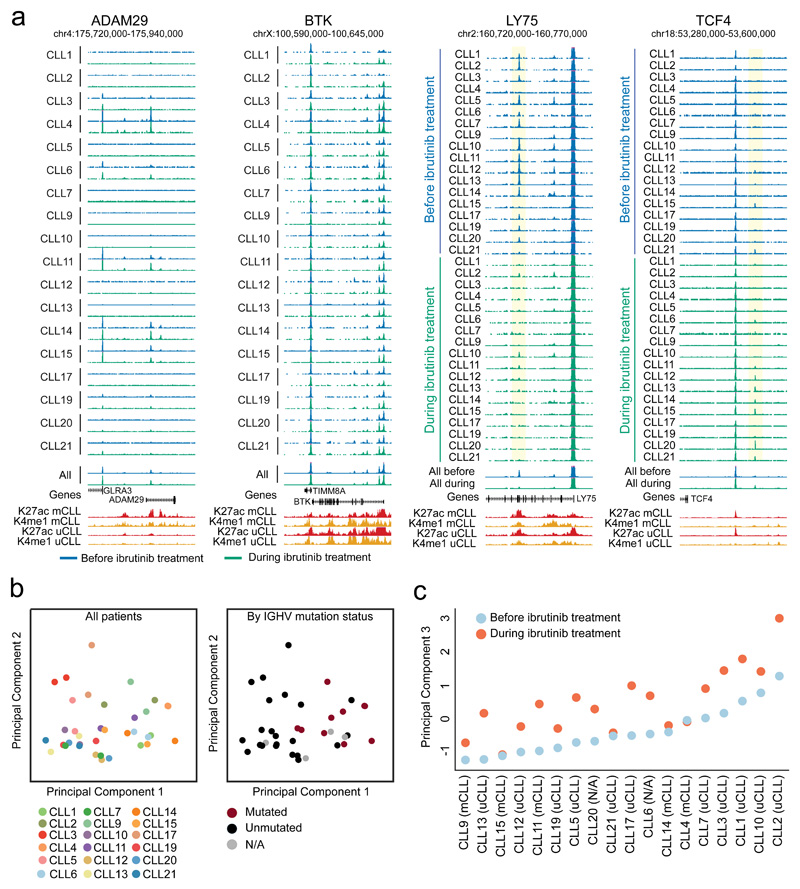
Figure 2. Chromatin accessibility mapping for matched CLL patient samples collected before and during ibrutinib treatment.
(a) UCSC Genome Browser snapshots showing chromatin accessibility data obtained by ATAC-seq for matched samples (n=36) collected before ibrutinib treatment (blue) and during ibrutinib treatment (green). ChIP-seq profiles for two promoter/enhancer associated histone marks (H3K27ac shown in red, H3K4me1 shown in yellow) in IGHV unmutated CLL (uCLL) as well as IGHV mutated CLL (mCLL) are included as an additional reference23. Regions that significantly lose or gain accessibility are highlighted in yellow. (b) Principal component analysis based on ATAC-seq signal intensities of all open chromatin sites in all CLL samples (n=36). Principal component 1 separated the samples by their IGHV mutation status, while there was no obvious correlate of principal component 2. (c) Principal component 3 separated the samples by their ibrutinib treatment status.

