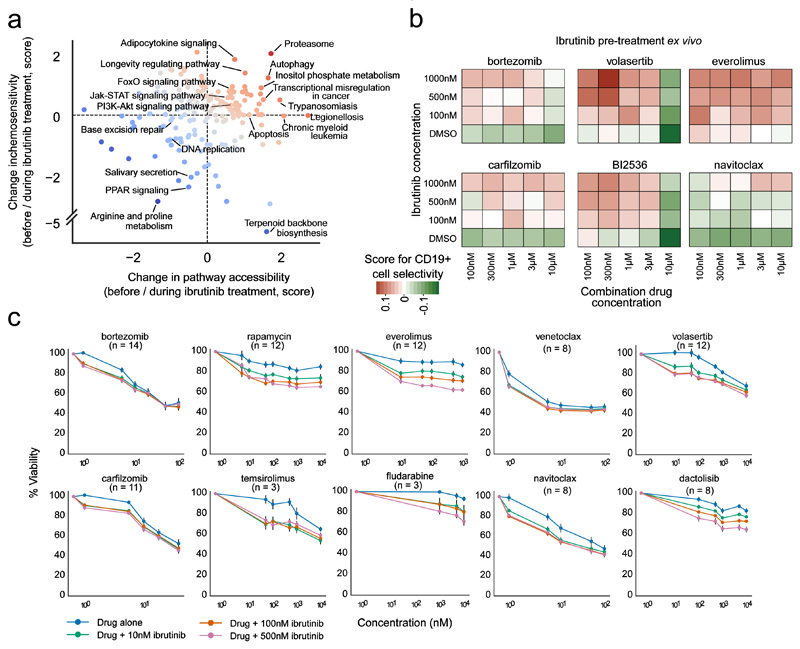
Figure 5. Prioritization and validation of ibrutinib-based drug combinations based on combined chemosensitivity and chromatin profiling.
(a) Integrative analysis of differential chromatin accessibility (x-axis) and differential cell-selective chemosensitivity (y-axis) at the pathway level. Red dots denote pathways characterized by higher chromatin accessibility and/or higher chemosensitivity during ibrutinib treatment than before ibrutinib treatment, while blue dots indicate lower chromatin accessibility and/or lower chemosensitivity. (b) Heatmap of CD19+ cell-selective cytotoxicity for combination matrixes of ibrutinib (y-axis) and six partner drugs (x-axis). Red indicates drug combinations that were selective for the CD19+ cell fraction, while green indicates combinations that were anti-selective. Results shown are averages across five patient samples, where each concentration point was measured in triplicate for each patient sample. (c) Drug responses (% viability) of primary CLL cells pretreated with different concentrations of ibrutinib in a co-culture model using primary bone marrow stromal cells. Viability was normalized to the effect of ibrutinib as a single agent. Error bars indicate the standard error of the mean (SEM) calculated across samples (numbers in brackets).

