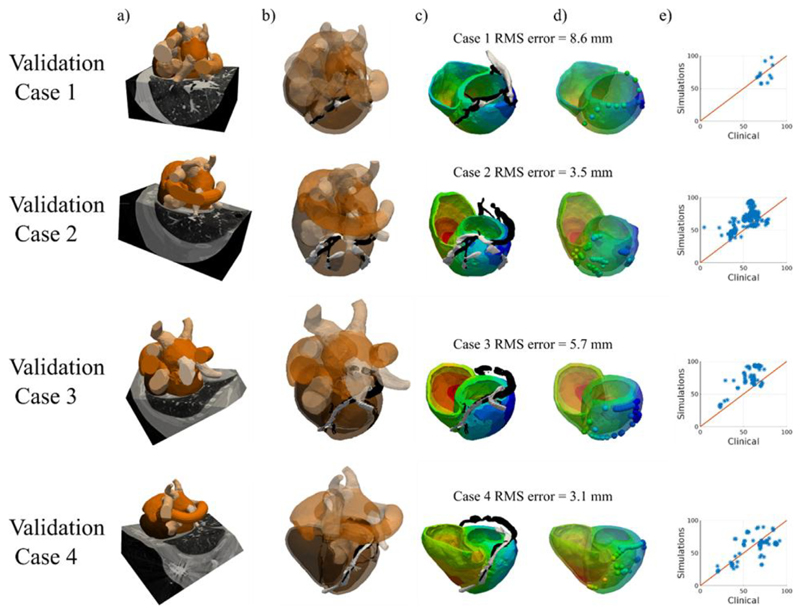
Fig. 5.
(a) CT images were acquired for 4 CRT upgrade patients and were automatically segmented using the Philips model based tool. (b) The EAM from Ensite NavX (white) was mapped to the coronary sinus semi-automatically segmented from the CT images (black). (c) The electrical activation across the ventricles from RV pacing was simulated. (d) The EAM local activation times were mapped onto the model (spheres) and the RMS distance error of the mapped EAM sites onto the models is stated for each case. (e) The LAT as a percentage of the QRS duration was compared between the clinical measurements and the model simulations with a six-fold increased conduction velocity in the ventricular endocardium.

