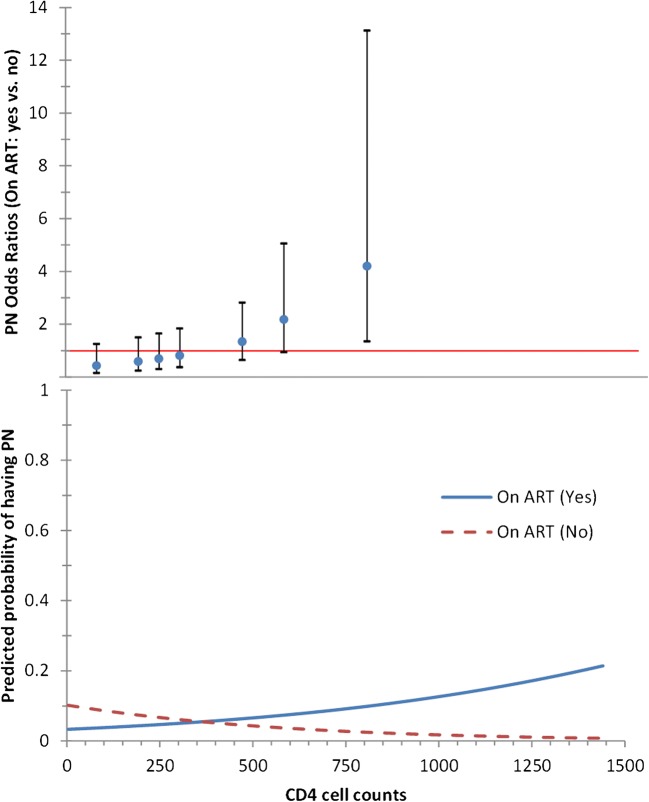
Fig. 1.
PN odd ratios (OR) for patients on ART (yes vs. no) with calculated predicted probability of having PN in relation to CD4 cell counts (adjusted for relevant factors as shown in Table 4). Top panel: OR of diagnosed PN in patients on ART at different CD4 cell counts (knots show the OR; whiskers the 95% CIs). Bottom panel: effect of the interaction between being on ART and CD4 cell counts on the PN-predicted probability (calculated at the mean values of 65.05 for waist girth, 77.04 for hip girth, lactate < 2.2 mmol/l, a height < 1.57 m, and education of < 9 years)

