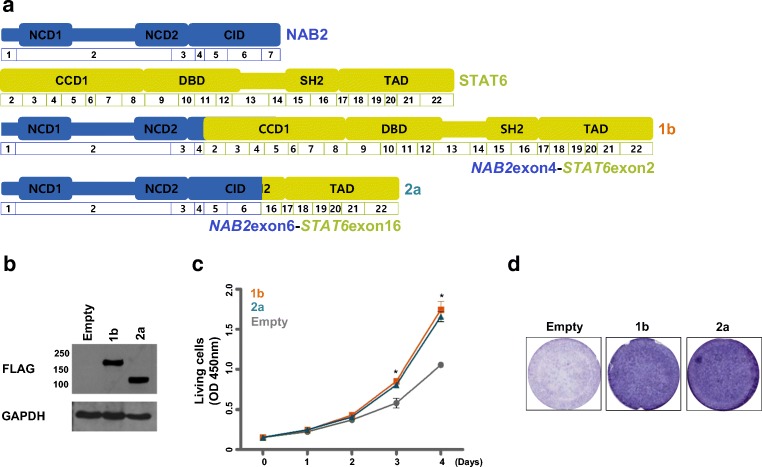
Fig. 3.
Comparison of representative 1b and 2a NAB2-STAT6 fusion variants’ roles on tumor progression. a Diagram of representative 1b or 2a NAB2-STAT6 fusion variants. b The ectopic-expression of representative variant 1b or 2a fusion proteins was validated by immunoblotting. c The cell proliferation was evaluated using WST-1 assay in stable NIH-3T3 cell lines expressing representative variant 1b or 2a forms (gray; empty, orange; long, greenish blue; short) (n = 3; bar represents the SE, Student’s t test was performed, P values are presented in comparison with empty and variant 1b or 2a forms). d Migration assay was performed in the Transwell chamber. The images of crystal violet-stained cells expressing the indicated protein on the membranes are depicted

