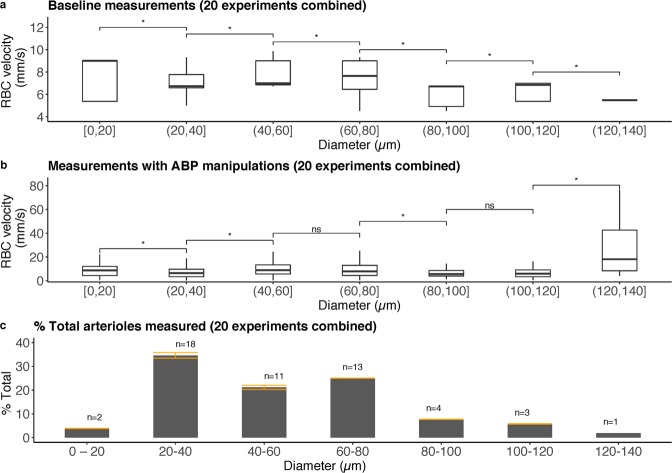
Figure 2.
Overview of RBC velocity and pial arteriolar diameters measured in 20 experiments combined (10 hypotensive and 10 hypertensive). A total of 52 randomly selected arterioles were studied with an average of 7.2 RBC tracks per arteriole (SD 3). (a) Baseline RBC velocity plotted as a function of pial arteriolar diameter in 20 experiments combined. (b) Measurements with ABP manipulations of RBC velocity plotted as a function of pial arteriolar diameter in 20 experiments combined. A significant increase in RBC velocity in diameter category 120–140 μm is the result of hypertensive forced vasodilation. (c) Histogram of baseline pial arteriolar diameter category of randomly selected arterioles in the 20 experiments plotted as a percentage of total pial arterioles studied, demonstrating the range of pial arteriolar diameters that were studied. Error bars in orange demonstrate the standard deviation per diameter category. The total number of arterioles (n) with baseline diameter within the diameter category is shown above each bar. Kruskal-Wallis test for analysis of differences between groups (ns: p > 0.05; *p < 0.05).

