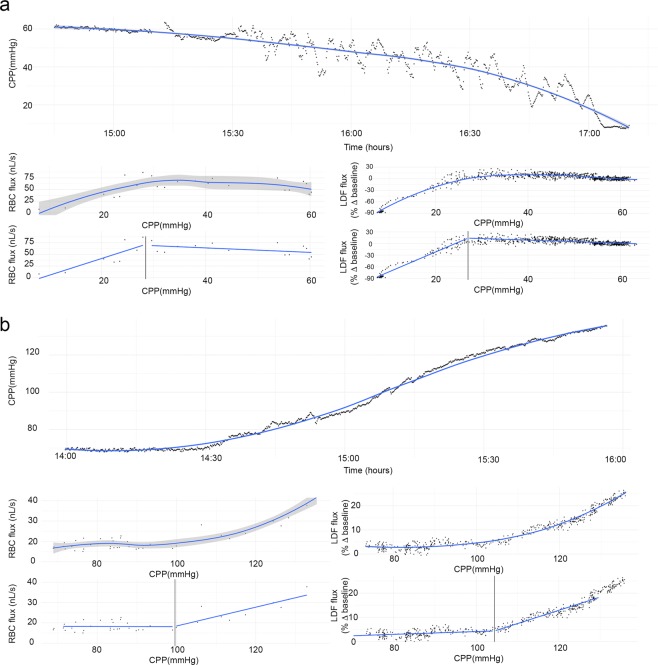
Figure 3.
Demonstration of a representative non-pharmacological arterial blood pressure manipulation in 2 animals: hypotension (a) and hypertension (b). The top panel of a and b shows cerebral perfusion pressure as a function of time. On the left, RBC flux as a function of CPP is shown with a second plot below demonstrating the segmented regression method for breakpoint estimation (vertical line delineates the breakpoint). On the right, LDF as a function of CPP is shown with a second plot demonstrating the segmented regression method for breakpoint estimation. Grey shading represents the standard error.

