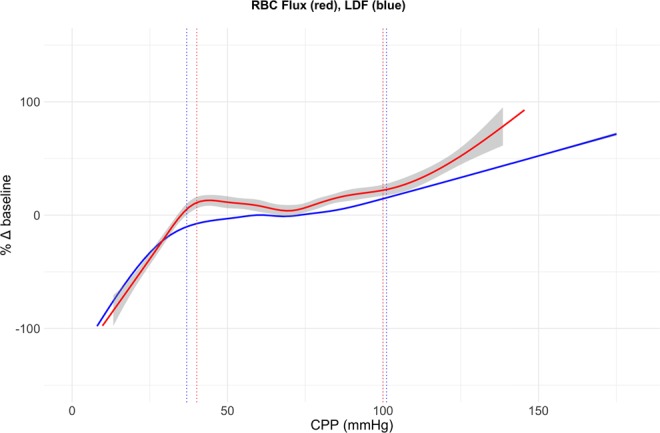
Figure 4.

Autoregulation curve Combined changes in LDF (blue) and RBC flux (red) for 10 hypotensive and 10 hypertensive experiments plotted against CPP. Grey shading represents the standard error (for the LDF data curve there was no visible standard error). Dotted lines show the mean lower and upper limits of autoregulation determined by segmented regression analysis of individual experiments as described in Table 2. Differences between breakpoints were not statistically significant for the lower (hypotensive experiments, p = 0.25) and upper (hypertensive experiments, p = 0.72) limits of autoregulation.
