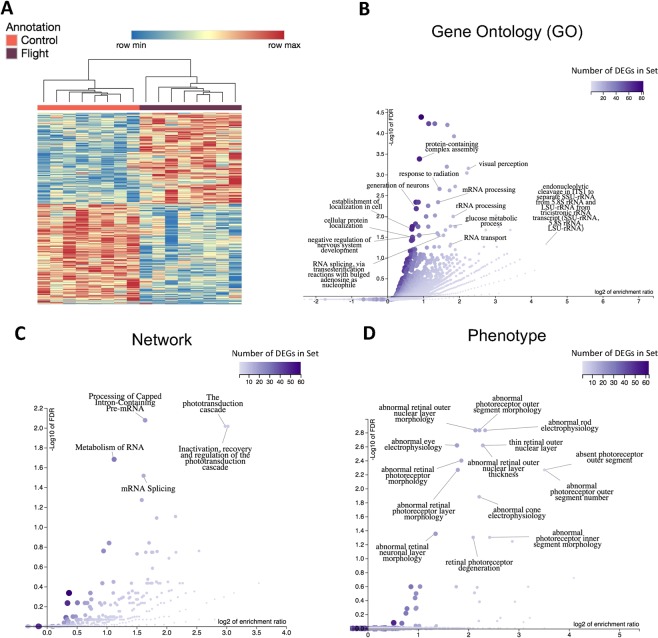
Figure 1.
DEG clustering and functions between spaceflight and control mice. (A) Hierarchical clustering of the 600 DEGs between spaceflight and control mice using an adjusted p-value threshold of 0.1. The spaceflight group had 286 upregulated genes and 314 downregulated genes compared to the ground control; (B) Enriched gene ontology (GO) biological process categories for DEGs. The affinity propagation option from WebGestalt was applied to the select representative display categories; (C) Enriched networks among DEGs from the Reactome database; (D) Enriched phenotypes impacted by the DEGs from the Mammalian Phenotype Ontology; (B–D) Overrepresented categories were found relating to ocular function (GO categories: ‘visual perception’, ‘response to light stimulus’, ‘sensory perception of light stimulus’, ‘retina development in camera-type eye’; Pathways: ‘the phototransduction cascade’ ‘inactivation, recovery and regulation of the phototransduction cascade’; Phenotype: electrophysiology, morphology, and degeneration of the retina, rods, and cones), various RNA processing, splicing, and metabolism functions (GO categories: ‘RNA processing’, ‘rRNA processing’, ‘mRNA processing’, ‘RNA splicing’, via transesterification reactions’, ‘mRNA splicing, via spliceosome’, ‘rRNA metabolic process’, ‘ncRNA metabolic process’, ‘mRNA metabolic process’, ‘RNA transport’), and direct responses to the physical pressures of spaceflight (GO categories: ‘response to abiotic stimulus’, ‘response to radiation’, ‘cellular response to stress’).

