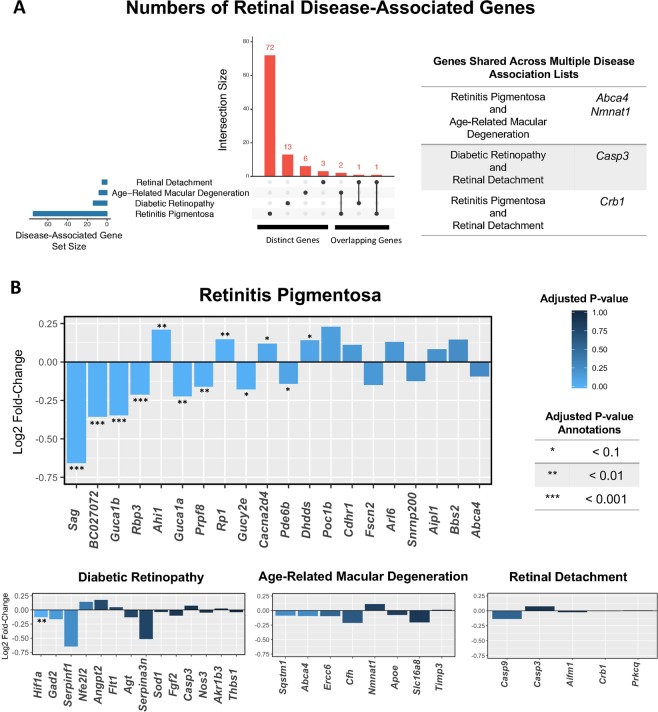
Figure 2.
Retinal disease-associated gene expression. (A) UpSet diagram showing the number of genes in each disease set from DisGeNet. Genes that are distinct to each set are in the first four columns. Genes shared among sets are in the last three columns; (B) Log2 fold-change values of disease-associated genes. Genes are plotted from left to right in order of adjusted p-value. Bars are colored by the magnitude of the adjusted p-value. Adjusted p-values are further annotated based on their order of magnitude. The plot for retinitis pigmentosa displays the top 20 most significant genes based on adjusted p-value. All other diseases are displaying all of their associated genes.

