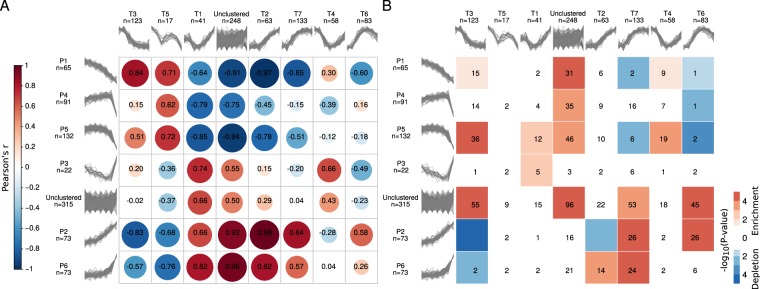
Figure 5.
Comparison between protein and transcript clusters. (A) Pearson correlation coefficients (in black) computed between the medians of the expression profiles of pairs of protein and transcript clusters. The correlation matrix based on the Pearson correlation coefficients between the median (log2) fold changes across the members of protein and transcript clusters was visualized using the R corrplot package90. The size and color of the circles are both indicators of the magnitude and sign of the correlation. The matrix was reordered based on hierarchical clustering using the complete linkage method. (B) Significance of the overlap (−log10 P-value calculated using Fisher’s Exact test) between the members of protein (rows) and transcript (columns) clusters. Significant enrichments are depicted in red and depletions in blue. The numbers indicate the size of the overlap; overlaps of size zero are not indicated.

