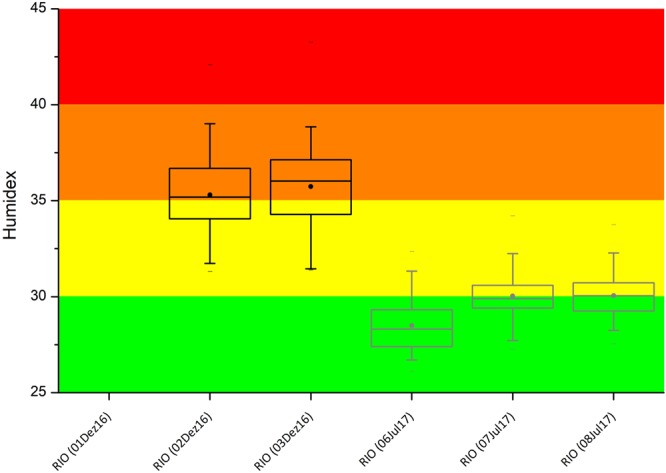
Figure 3.

Humidex index in Rio de Janeiro during Meteorotropic experiment. Vertical lines show the 5–95 percentile intervals, dots are the mean and horizontal lines inside the boxes are the medians of Humidex. Black and gray boxes indicate summer and winter measurements, respectively. Colored stripes show comfort levels. Green: H < 29 – Little or no discomfort; Yellow: 30 < H < 34 – Noticeable discomfort; Orange: 35 < H < 39 – Evident discomfort; and, Red: 40 < H < 45 – Intense discomfort, avoid exertion. Data from Dec 01, 16 could not be recorded due to weather conditions.
