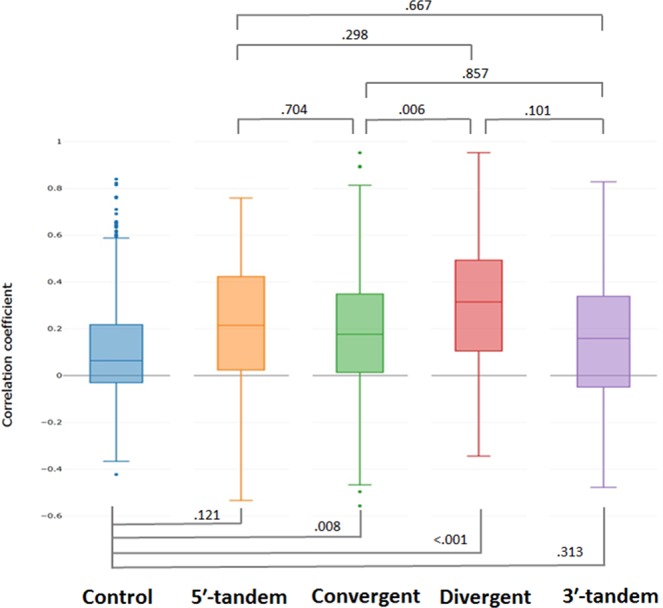
Figure 3.

Correlation coefficients of the control group and four subtypes of paired overlapping genes. Boxplots show the correlation coefficient levels of gene expression associations, which included randomly selected non-overlapping genes (the control group) and paired overlapping gene subtypes. Four subtypes of paired overlapping genes: 5ʹ-tandem overlap subtype; convergent overlap subtype; divergent overlap subtype; and 3ʹ-tandem overlap subtype. Fisher’s z test was used to evaluate the significance of differences between two correlation coefficients in subtypes of paired overlapping protein-coding genes. Comparing with the control group, the convergent and divergent overlapping protein-coding gene groups show significant difference. Among the four subtypes, the convergent and divergent overlapping protein-coding gene groups also showed significant variations.
