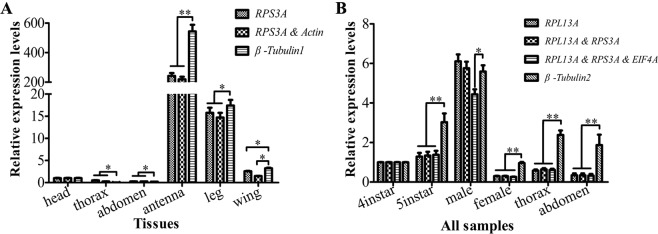
Figure 6.
Validation of the gene stability measures. Expression levels of a target gene, OBP3, in six tissues (A) and all samples (including two tissues, two developmental stages, and two sexes) (B) were tested by different normalization reference genes. Bars represent the means and standard deviations of three biological replicates. Single asterisk indicates significant differences among different treatment within OBP3 expression by normalized by reference gene or combination (P < 0.05, Duncan’s test), and double asterisks show extremely significant differences in the expression of OBP3 (P < 0.01, Duncan’s test).

