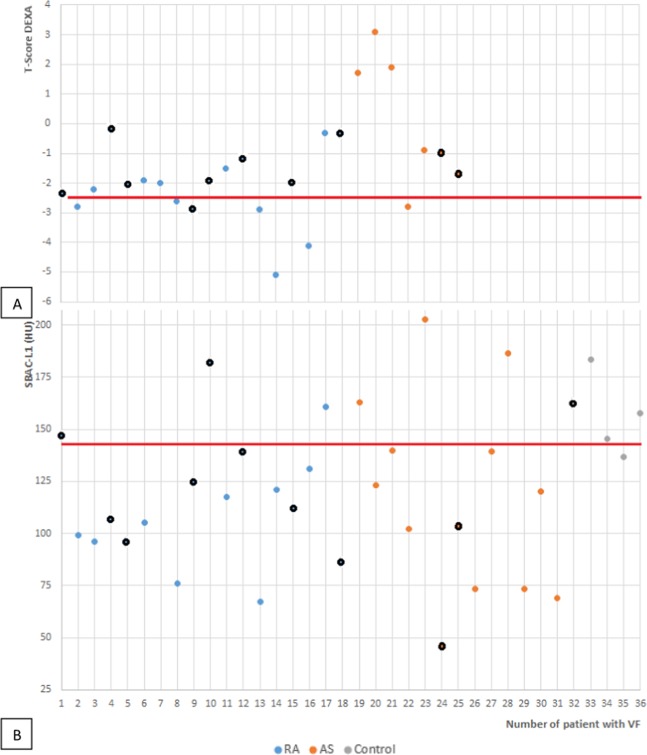
Figure 4.
Spine T-score (A) and SBAC-L1 (B) distribution of the patients with VFs for the different groups. The black circle represents the grade 1 VFs. (A) The red line stands for the threshold of −2.5 SD, the definition of osteoporosis on DEXA. (B) The red line stands for the fracture threshold of 145 HU. Note that patient no. 7 did not have an available SBAC-L1. AS: Ankylosing spondylitis, RA: Rheumatoid Arthritis. VF: Vertebral Fracture, SBAC-L1: Scanographic Bone Attenuation Coefficient of the first lumbar vertebra, HU: Hounsfield Unit, DEXA: Dual Energy X-ray Absorptiometry.

