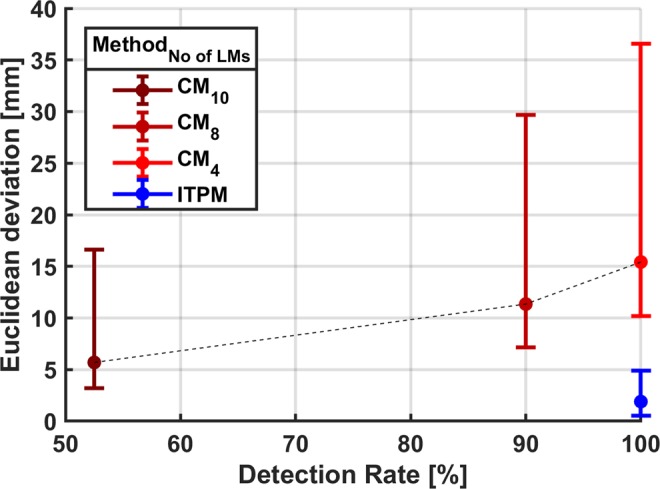
Figure 7.

Relationship between the detection rate and the Euclidean deviation (Median, interquartile range) for the PSISs. The results of the curvature method (CM) for a varying number of landmarks (No of LMs) in the spatial relationship matrix are depicted in shades of red. The result for the ITP method (ITPM) is depicted in blue. CM4 detects the PS, ASISs, PSISs and ISs. In addition to the landmarks of CM4, CM8 detects the AIISs, IPYs, IITs and ITs. In addition to the landmarks of CM8, CM10 detects the PIISs and ISs. ITPM detects the PS, ASISs, PSISs, ISs and SP.
