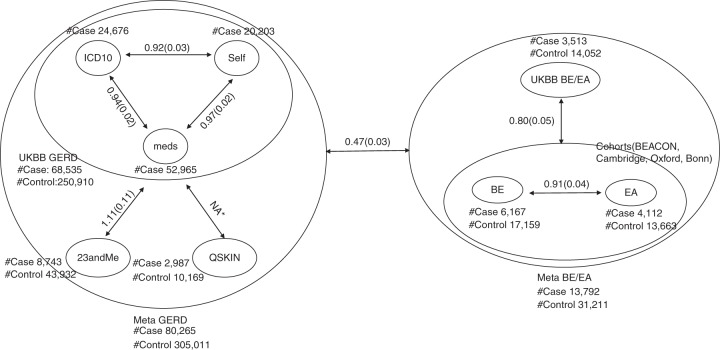
Fig. 1.
Genetic correlation between phenotypes. The lines with two arrows show the genetic correlation (standard error in brackets) from the result of LD-score regression rg, genetic correlation estimates from the LD score regression. There is sample overlap between UKBB cases with either ICD10, self-report or medicine based GERD and the numbers do not add up to the total UKBB samples size. As the correlation is computed as the estimated covariance divided by product of the estimated standard error of the two traits, the correlation estimates may be slightly >1 when the correlation is high. NA* sample size is too small to estimate rg

