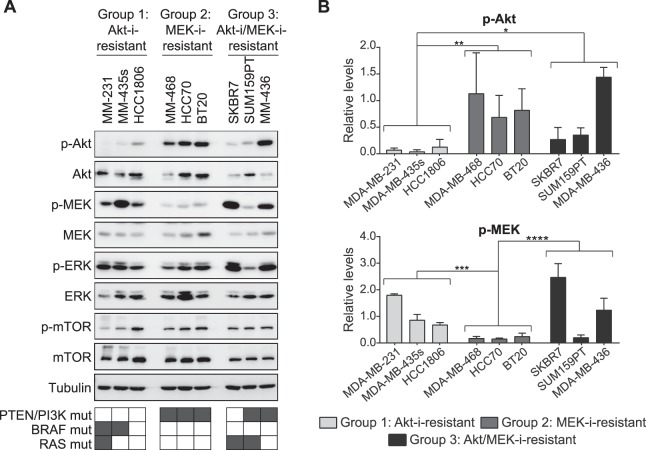
Figure 2.
Basal levels of p-Akt and p-MEK in TNBC and drug resistance. (A) Western blot analysis and (B) quantification of p-Akt and p-MEK levels in the Akt-i-resistant, MEK-i-resistant and double-resistant cell lines. P-Akt and p-MEK levels were normalised to tubulin. Data are expressed as means ± SD of two independent experiments (two-way ANOVA, *P < 0.05, **P < 0.01, ***P < 0.001, ****P < 0.0001). Full-length uncropped blots are shown in Supplementary Fig. S4.

