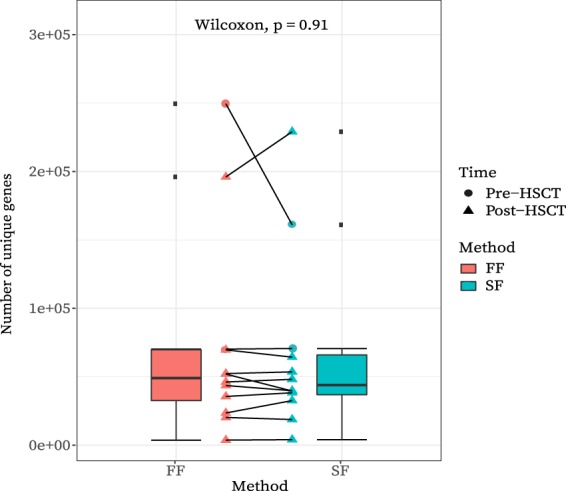
Figure 3.

Gene richness (i.e. the number of unique genes) for each sample per method and connected as sample pairs. Circle vs triangle shapes represent pre-HSCT vs post-HSCT samples respectively. Box plots show interquartile ranges (minimum and maximum values as whiskers) for gene richness per sampling method. A Wilcoxon paired test found no significant difference in the mean gene richness between fresh-frozen (FF) and stabilized-frozen (SF) samples. This figure has been created with help of the R(v3.5.0)29/PhyloSeq37 package.
