
Figure 4.
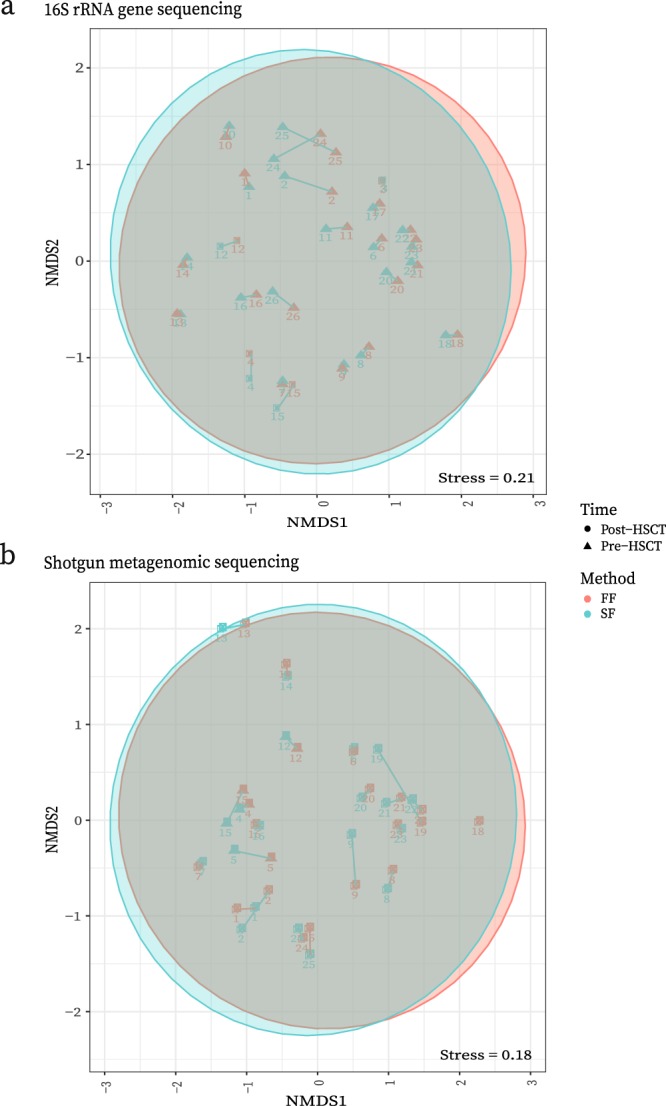
(a) 16S rRNA gene sequencing data of beta diversity using Bray-Curtis distances to compare sampling methods represented in a NMDS plot. Sampling pairs are connected by lines with circle vs triangle shapes representing pre-HSCT vs post-HSCT samples respectively. FF = Fresh-frozen, SF = Stabilized-frozen. (b) Shotgun metagenomic sequencing data of beta diversity using Bray-Curtis distances to compare sampling methods represented in a NMDS plot. Sampling pairs are connected by lines with circle vs triangle shapes showing sampling time relative to HSCT. FF = Fresh-frozen, SF = Stabilized-frozen. These figures have been created with help of the R(v3.5.0)29/PhyloSeq37 package.