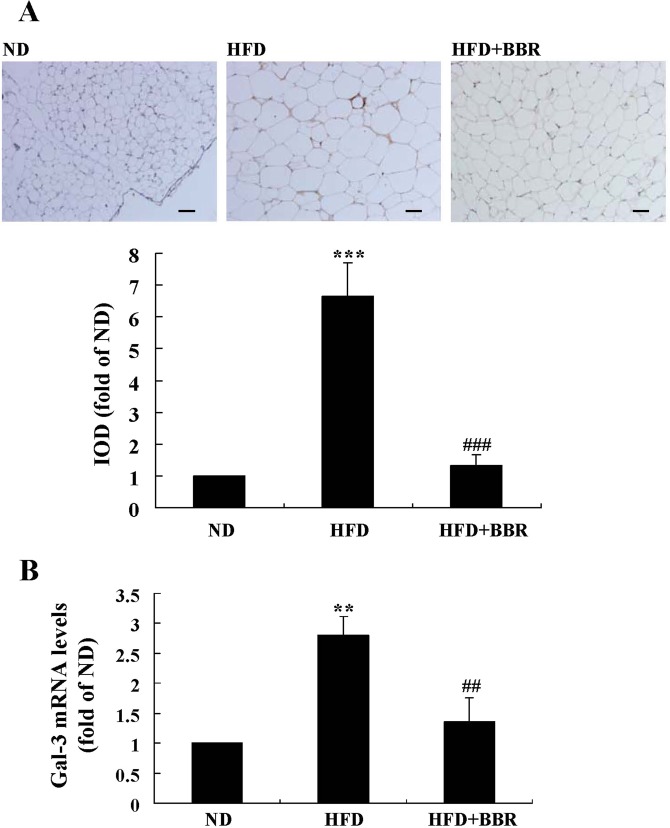
Figure 13.
Effects of BBR on eWAT Gal-3 expression in mice fed a HFD. Male C57BL/6 J mice were grouped and treated as described in “Methods”. At the end of experiment, mice were sacrificed, and eWATs were subjected to paraffin sectioning. After dewaxing, Gal-3 protein expression levels were analyzed by IHC staining(×200, scale bar = 400 μm) (A, upper panel) and integrated optical density (IOD) values (A, lower panel) were determined. Meanwhile, Gal-3 mRNA expression levels in eWATs were analyzed by real-time RT-PCR, normalized to ACTB, and presented as fold of ND group (B). Values are mean ± SD of 10 mice in each group. **p < 0.01, ***p < 0.001 vs. that of ND group; ##p < 0.01, ###p < 0.001 vs. that of HFD group.

