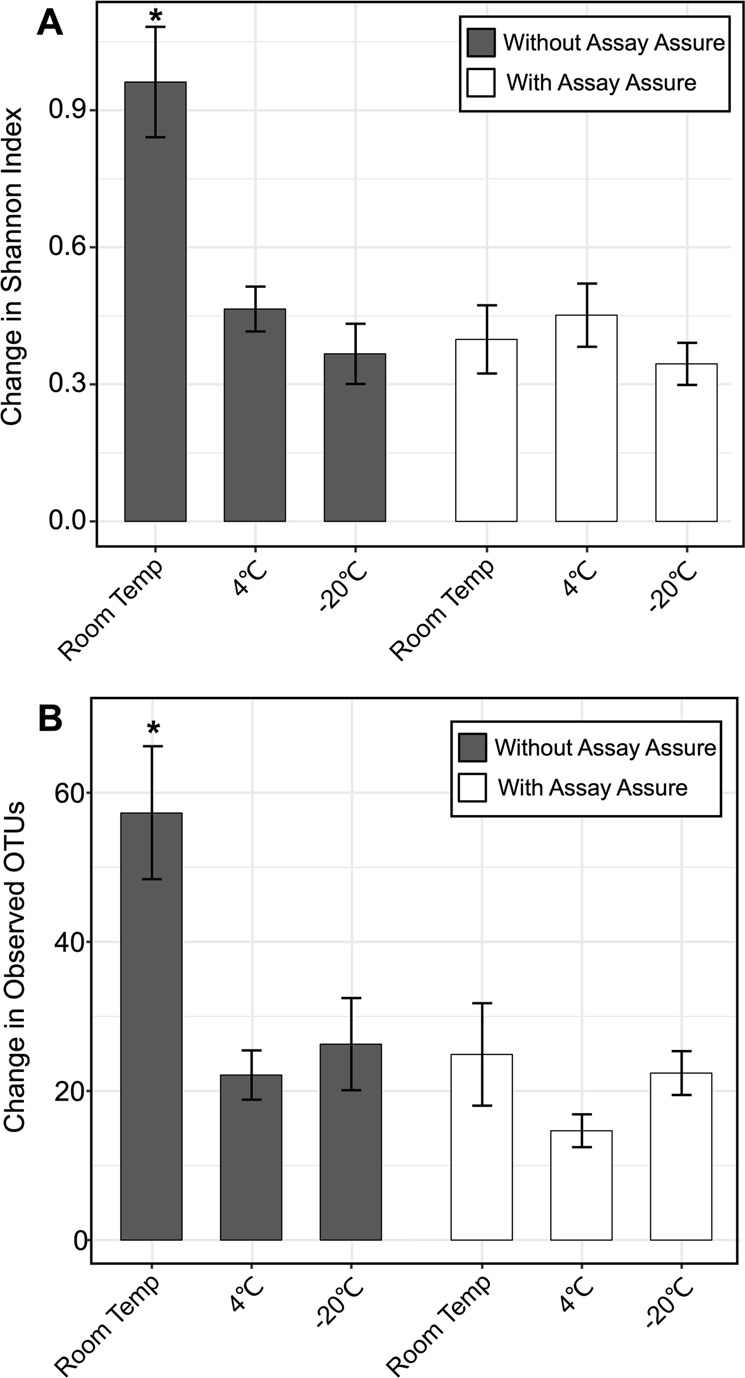
Figure 3.

Bar graphs representing mean changes in the (A) Shannon Index (±standard error) and (B) Observed OTU values (±standard error) compared to the index time point (time point where urine specimens were collected and then immediately frozen at −80 °C) for urine specimens from all participants. Urine specimens preserved in AA are demonstrated by the white bars, and specimens without preservative are shown by gray bars. The mean change in alpha diversity measures are shown on the y-axis and specimen storage conditions are demonstrated on the x-axis. The ‘*’ represents values that are statistically significant with p-values ≤ 0.05 determined by an ANOVA with post-hoc Tukey HSD.
