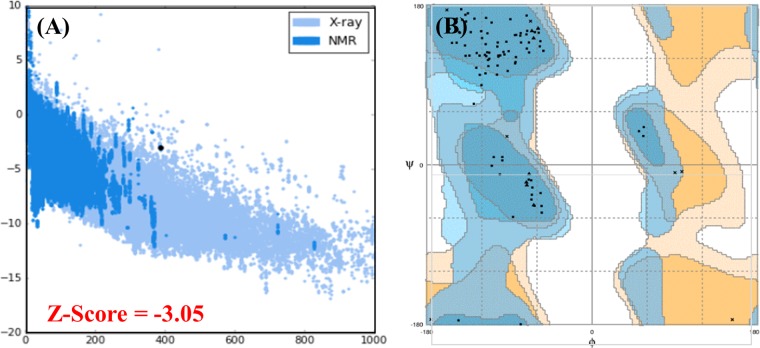
Figure 6.
Ramachandran plot and PROSA-web server analysis are given in the above figure. The Z-score (−3.05) predicted by the PROSA-web is given in panel (A) while the distribution of each amino acid in the favoured, allowed and disallowed region are shown by using Ramachandran plot in the panel (B). Overall 82.5% residues were reported to be in favoured region, 13.9% in allowed while 3.6% were reported to be in disallowed region respectively.

