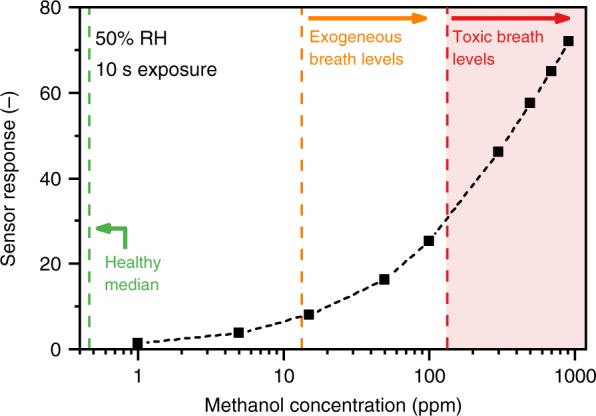
Fig. 3.

Dynamic range of the detector. Response of the detector (Tenax separation column + Pd-doped SnO2 sensor) to 1–918 ppm methanol concentrations (black squares and dashed line). The median methanol concentration in healthy breath35 (green dashed line), exogeneous36 (orange dashed line), and toxic1 breath levels (red dashed line and shaded area) are indicated. Measurements were performed with 10 s exposure of all methanol concentrations at 50% RH and a flow rate of 25 mL min−1 through the detector
