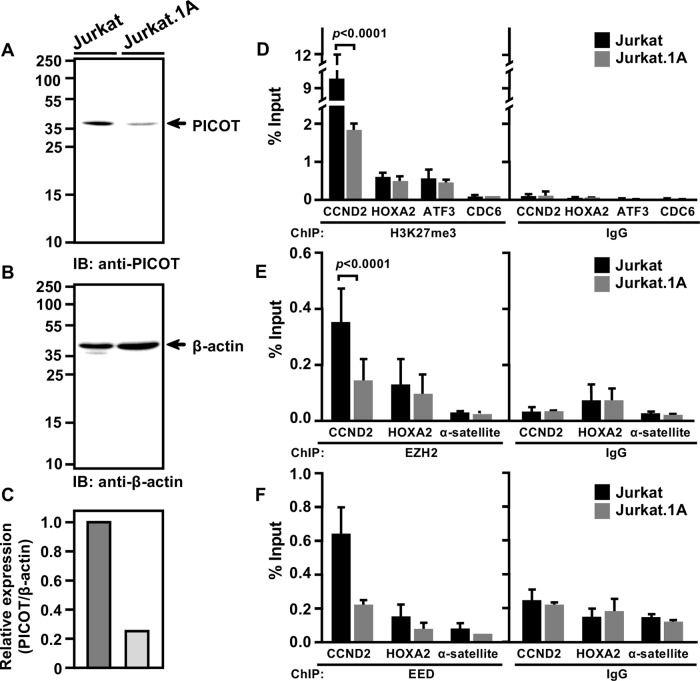
Fig. 4. Knockdown of PICOT results in reduced association of H3K27me3, EED, and EZH2 with the CCND2 gene promoter.
Jurkat and PICOT-deficient Jurkat.1A cells were resuspended in lysis buffer on ice (30 min) and centrifuged. Nuclear free supernatants were collected, boiled, and subjected to SDS-PAGE on 10% gel under reducing conditions (12.5 µg/lane). Proteins were electroblotted onto a nitrocellulose membrane and sequentially immunoblotted with mouse anti-PICOT (a) and mouse anti-β-actin mAbs (b) followed by the immunoperoxidase ECL detection system and autoradiography. A bar graph shows the relative expression of PICOT in the two cell lines (c). For ChIP-qPCR assay, Jurkat and Jurkat.1A cells (20 × 106/group) were fixed using 1% formaldehyde (10 min at room temperature), washed twice in cold PBS, and then lysed by resuspension in lysis buffer for 10 min on ice. Nuclear pellets, obtained by centrifugation (5 min, 5000 rpm) were resuspended in nuclear lysis buffer, sonicated, centrifuged, and precleared on protein G-sepharose beads. The chromatin lysates were incubated with protein-G sepharose bead-immobilized rabbit anti-H3K27me3 mAbs (d), rabbit anti-EZH2 mAbs (e), rabbit anti-EED polyclonal Abs (09–774) (f), or rabbit anti-IgG Abs, as a control. After overnight incubation on a rotator, the beads were washed sequentially with low-salt buffer, high-salt buffer, LiCl buffer and tris-EDTA buffer. Precipitated DNA was eluted from immune complexes and in parallel, DNA was eluted from the crude sonicated chromatin lysates. Isolated DNA was tested for the presence of several target genes using appropriate sets of primers in RT-PCR. The relative level of protein enrichment following immunoprecipitation with specific Abs vs. isotype control (IgG) at different gene loci in Jurkat vs. Jurkat.1A was determined as a percentage of the total input signal. Bar graph represents the mean ± standard deviation of the calculated values (d–f). The ChIP assay was biologically repeated twice and the qPCR analyses were performed in triplicates. CDC6 and α-satellite were used as non-target genes and ChIP using IgG served as a negative control for immunoprecipitation. Two-way ANOVA was calculated using GraphPad Prism 7 software to determine the level of significance between two cell lines

