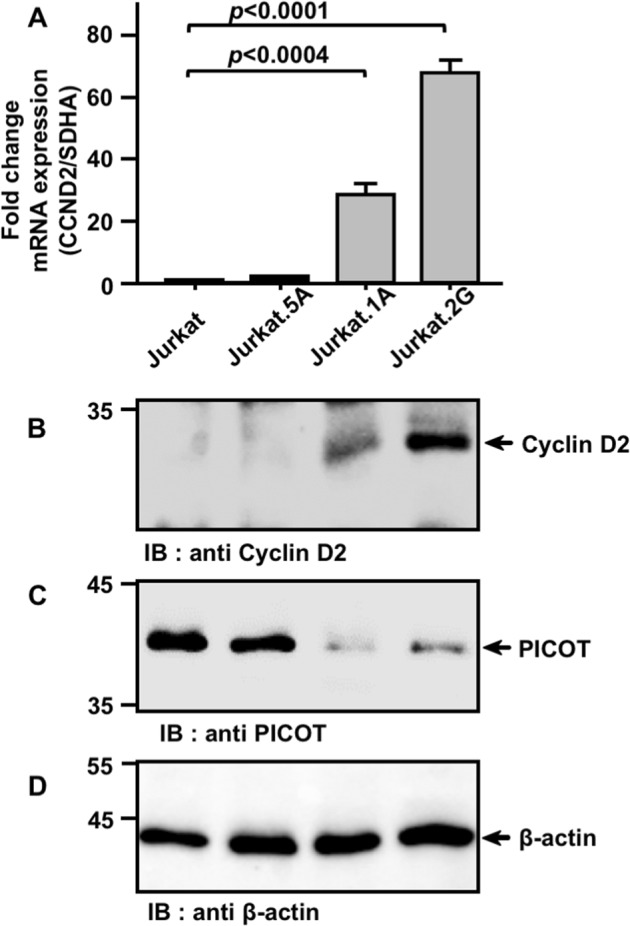
Fig. 5. PICOT expression in Jurkat T cells negatively correlates with CCND2 mRNA and protein expression.

a. RNA was extracted from Jurkat cells, PICOT-deficient sh-PICOT-expressing Jurkat sublines (1A and 2G), and a control, sc-PICOT expressing Jurkat subline (5A). Total RNA from each sample (1 µg/sample) was isolated and served as a template for complementary DNA (cDNA) preparation using the Bio-RTTM first strand cDNA synthesis kit (Bio-Lab) plus random hexamer primers. The cDNA generated during reverse transcription then served as template in the subsequent qRT-PCR that was carried out in the presence of CCND2 or SDHA gene-specific primers and the double-strand DNA intercalating fluorescent dye, SYBR® green. The relative fold change in CCND2 mRNA was determined by the ΔΔCt method and calculated relative to the SDHA mRNA. The results are presented as a bar graph where mean ± standard error are indicated. Real-time PCR analyses were biologically repeated thrice with triplicate wells in each experiment. One-way ANOVA test was calculated using GraphPad Prism 7 software to determine the level of significance. b–d. For Western blot analysis, Jurkat and Jurkat-derived subclones (5 × 10⁶ cells/group) were resuspended in lysis buffer on ice (30 min), centrifuged and nuclear free supernatants were collected. Cell lysates (2.5 µg/lane) were boiled and subjected to SDS-PAGE on 10% gels under reducing conditions. Proteins were then electroblotted onto a nitrocellulose membrane, immunoblotted with rabbit anti-Cyclin D2 mAbs (b) followed by immunoperoxidase ECL detection system and autoradiography. Parallel membranes were immunoblotted with mouse anti-PICOT mAbs (c) and mouse anti-β-actin mAbs (d). The position of specific protein bands is indicated by arrows. Results are representative of three independent experiments
