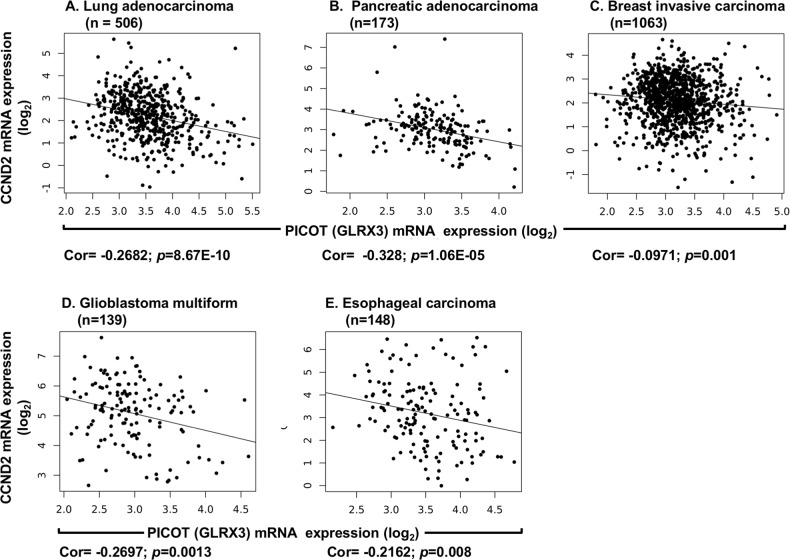
Fig. 6. The expression levels of PICOT mRNA in five different types of human cancer negatively correlate with the CCND2 gene mRNA expression levels.
PICOT (Glrx3) and CCND2 mRNA expression levels in five different types of human cancer tissues were downloaded from the TCGA using ISB Cancer Genomics Cloud. Outlier samples were removed by clipping the top and bottom deciles of each expression distribution. The correlation between PICOT and CCND2 mRNA expression is illustrated as scatter plots where each dot represents a single cancer tissue sample. For each type of cancer, the total number of patients (N), the Pearson’s correlation value (Cor), and the p value are indicated

