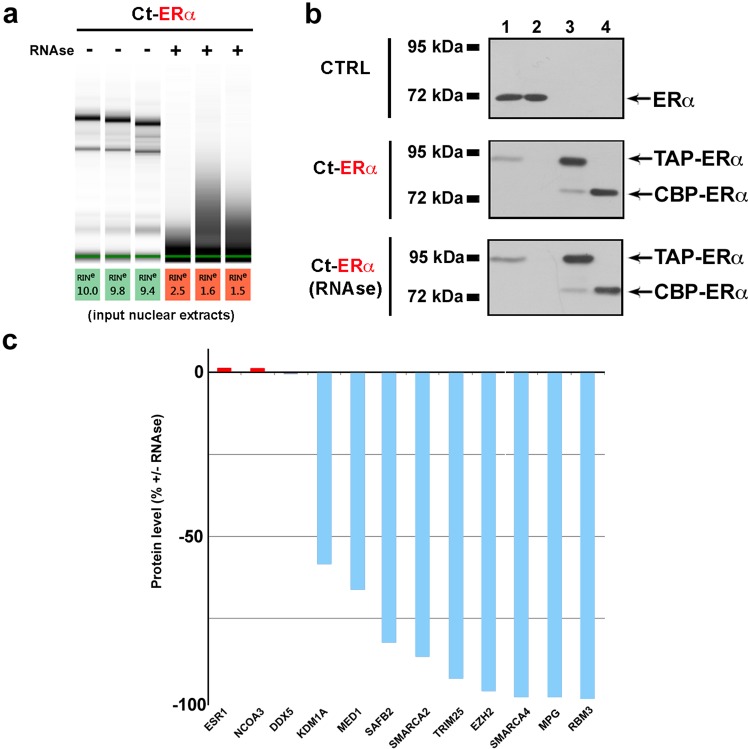
Fig. 3.
Quality controls of the experimental procedure. (a) Electrophoretic analysis of RNA extracted from nuclear extracts (starting material) before and after RNase treatment. (b) Representative Western Blot (one of the three biological replicates of the study) of the different steps of the Tandem Affinity Purification protocol in wt MCF-7 (CTRL, up) and Ct-ERα cells before (middle) and after (down) RNase treatment. The presence of the indicated proteins has been evaluated in different fractions as described: lanes 1 and 2, Crude nuclear extracts before and after IgG-Sepharose binding respectively; Lanes 3, IgG-Sepharose-bound proteins before TEV elution; Lanes 4 (TEV elution), proteins eluted from IgG-Sepharose. (c) Bar plot showing protein levels (%) of ERα and some of its interactors (+vs − RNase). Unchanged proteins are reported in gray, decreased proteins in blue.

