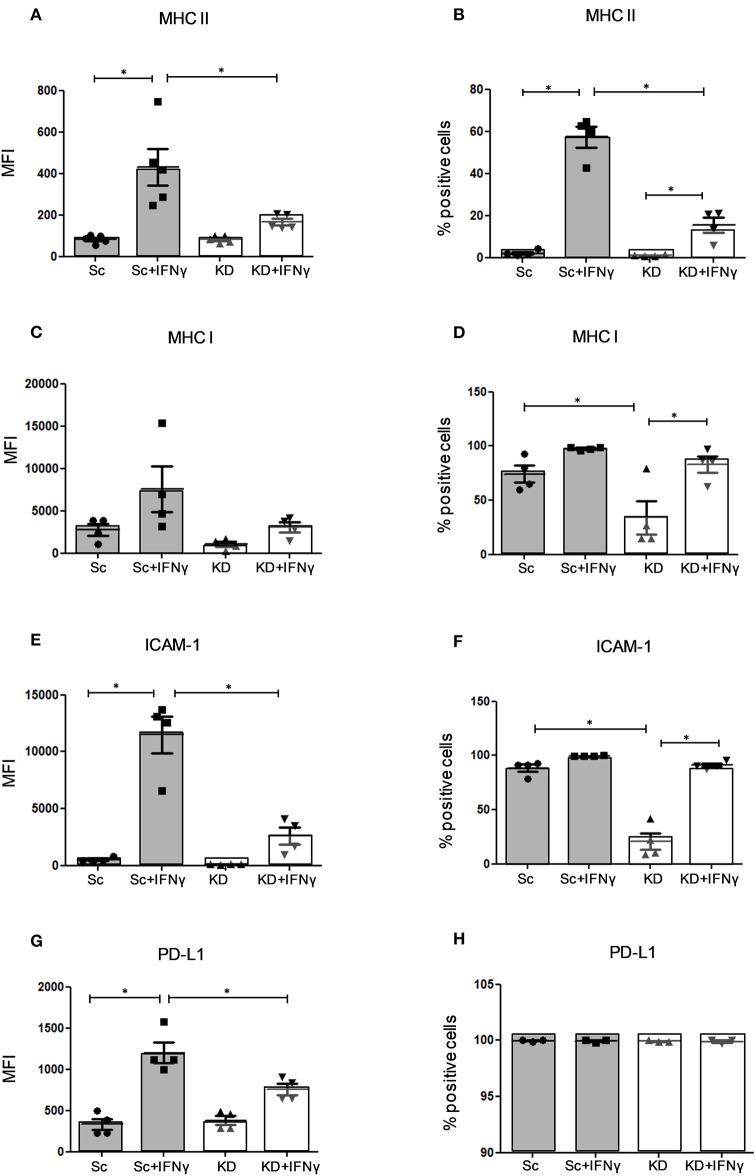
Figure 2.
Analysis of MHC I/II, ICAM-1 and PD-L1 expression in hTERT urothelial cells by Flow Cytometry. Flow cytometry analysis of surface receptor expression in KD and Sc hTERT immortalized urothelial cell lines before and after IFNγ stimulation. Mean fluorescence intensity and percentage of positive cells are shown for (A,B) MHC II (C,D) MHC I (E,F) ICAM-1, and (G,H) PD-L1 expression. Data is from four independent experiments for (A–F) and from three independent experiments (G,H). One-way ANOVA with Tukey's Multiple Comparison post-test. Graphs shows mean values ± SE and regulation of the expression compared to untreated. *P < 0.05. Error bars represent the SE.

