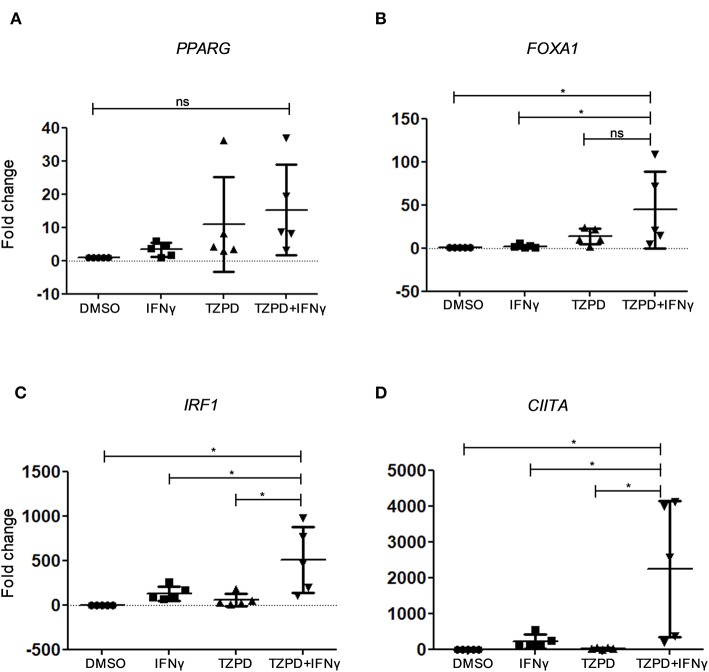
Figure 6.
Expression of IFNγ-regulatory genes and intermediary transcription factors in NHU cells by RT-qPCR. (A–D) RT-qPCR analysis of gene expression in five non-immortalized NHU cell cultures obtained from five different donors, with or without IFNγ (200 U/ml) and/or TZ (1 μM) + PD153035 (1 μM) stimulation for 48 h compared with the vehicle-only (0.1% DMSO) control. Data are from five independent experiments each using a different NHU cell donor. One-way ANOVA with Tukey's Multiple Comparisons Test. *P < 0.05. Error bars represent the SE.

