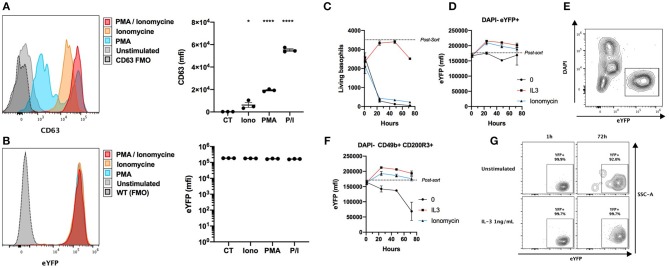
Figure 2.
eYFP expression is robust during basophil degranulation and lifespan. (A,B) Whole splenocytes from Basoph8 mice were stimulated for 2 h with 100 ng/mL of PMA, ionomycin (Iono), or PMA + ionomycin (P/I), or left unstimulated (CT). CD49b+ CD200R3+ basophils expression of CD63 (A) and eYFP (B) is depicted in histograms and represented as mean fluorescence intensity (mfi) (n = 3). (C–G) 5,000 eYFP+ basophils were FACS sorted from the spleen of Hp infected mice at day 15, and stimulated with 1 ng/mL of IL-3, 100 ng/mL of ionomycin, or left unstimulated (n = 6). Their number (C) and phenotype was assessed post-sort, and at 1, 24, 48, and 72 h post stimulation. (D) The expression of eYFP by DAPI- eYFP+ basophils. (E) Representative contour plot showing the identification of eYFP+ living basophils left unstimulated at 24 h. (F) The expression of eYFP by DAPI- CD49b+ CD200R3+ basophils. (G) Representative contour plots showing the expression of eYFP by DAPI- CD49b+ CD200R3+ basophils in different conditions at different time points. Statistics are a one-way ANOVA with a Dunnett's comparison to the control value (A,B) Non-significant is not represented; *p < 0.05; ****p < 0.0001. (D,F) Statistics are detailed in the text body for clarity. Data are representative of two independent experiments giving similar results (A,B) or show pooled data from two independent experiments (C–G).

