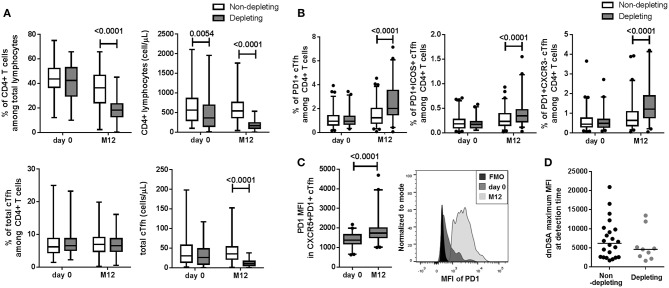
Figure 3.
Depleting induction treatment altered cTfh frequency at M12. (A) Compared to non-depleting or no induction treatment (white boxes), the ATG-depleting induction treatment (gray boxes) was associated with a decrease in CD4+ T lymphocyte frequency and number, a decrease in total cTfh number at M12 (p < 0.0001) but not with total cTfh frequency. (B) Increase frequencies of the three CXCR5+PD1+, CXCR5+PD1+ICOS+, and CXCR5+PD1+CXCR3− activated cTfh subsets were associated with depleting treatment at M12 (B, p < 0.0001). (C, left) Depleting treatment was associated with an increase of PD1 MFI in CXCR5+PD1+ cTfhs at M12 compared to day 0 (p < 0.0001). (C, right) Representative histograms of PD1 MFI in total cTfhs from one patient at day 0 and M12 are displayed. (D) No difference between dnDSA intensity (maximum of MFI) at detection time was observed (p = 0.41). For A, B, and C, whisker boxes with 95% confidence intervals are displayed. P-values of paired Wilcoxon (for A, B, and C) and Mann-Whitney (D) tests are indicated.

