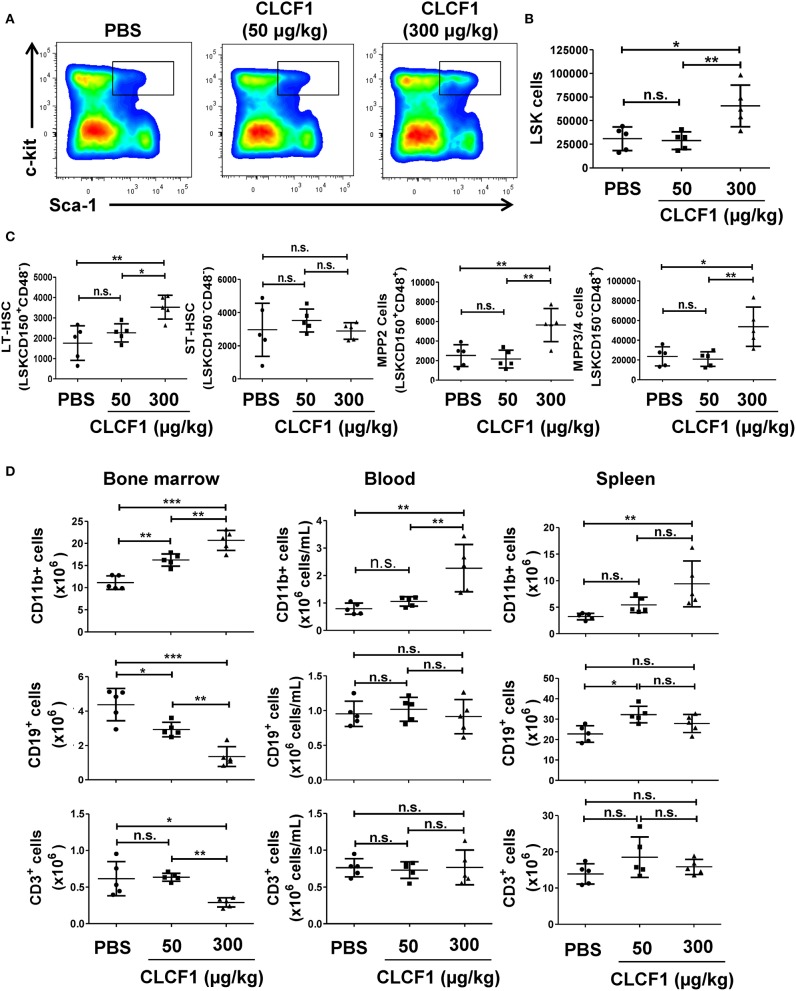
Figure 3.
CLCF1 administration to healthy mice up-regulate LSK and myeloid cell levels in the BM. (A,B) Frequency and count assessment of LSKs at day 8 post-CLCF1 administration. (C) Absolute counts of BM LSKsCD150+CD48− (LT-HSCs), LSKsCD150−CD48− (ST-HSCs), LSKsCD150+CD48+ (MPP2), and LSKsCD150−CD48+ (MPPs). (D) Absolute counts of BM-, blood- and spleen-resident CD11b+ cells, CD19+ cells and CD3+ cells at day 8. Graphs represent absolute count in mean ± S.D (n = 5 per group). *P < 0.05, **P <0.01, ***P < 0.001.

