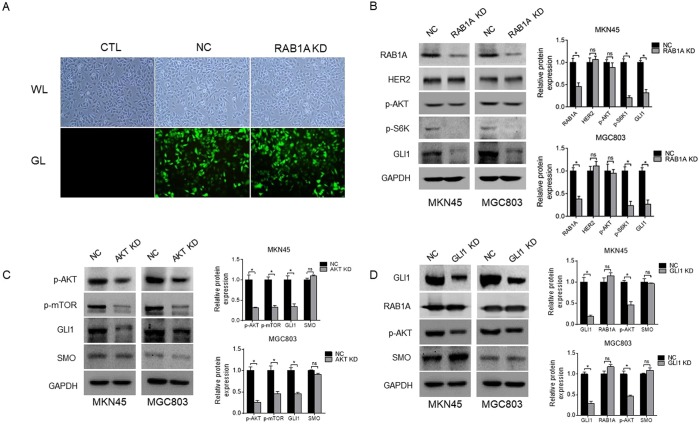
Figure 4.
The relationship between Rab1A expression and the mTOR complex in GC cells. (A) Representative fluorescence imaging showing transfection efficiency in untreated control (CTL), shRab1A (Rab1A KD) and negative control shRNA (NC) groups. (B) Immunoblot showing levels of Rab1A, HER2, p-AKT, p-S6K and GLI1 protein in MKN45 cells and MGC803 cells transfected with shRab1A (Rab1A KD) or negative control shRNA (NC). (C) Immunoblot showing levels of p-AKT, p-mTOR, GLI1 and SMO protein in MKN45 cells and MGC803 cells after AKT knockdown. (D) Immunoblot showing levels of Gli1, Rab1A, p-AKT and SMO protein in MKN45 cells and MGC803 cells after GLI1 knockdown.

