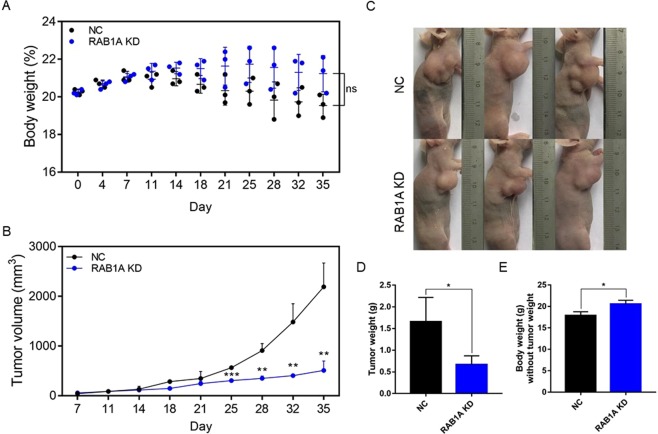
Figure 6.
Rab1A knockdown suppresses GC tumor growth in vivo. (A) The body weight of the mice during the 5 week experiment. Data are presented as mean ± S.E.M. (B) The tumor volume during the indicated 5 weeks. Data are presented as mean ± S.E.M. (C) Representative pictures of mice inoculated with control and Rab1A-knockdown GC cells. (D) The weight of tumor masses after 5 weeks. Data are presented as mean ± S.E.M. (E) The body weight of the mice after subtracting the respective tumor weight. Data are presented as mean ± S.E.M.

