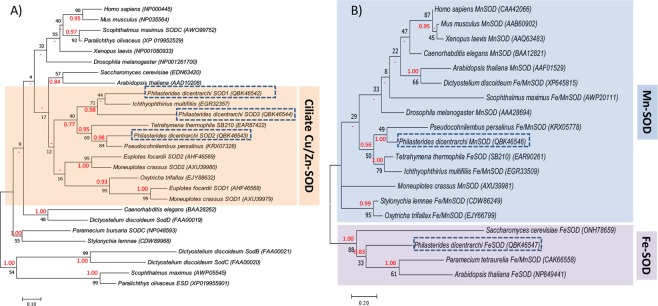
Figure 3.
Phylogenetic analysis of (A) P. dicentrarchi Cu/Zn-SODs and (B) Fe/Mn-SOD proteins by the Maximum Likelihood (ML) and Bayesian inference (BI) methods, respectively. The trees with the highest log likelihood (A) (−4402.19) and (B) (−1780.26) are shown. Evolutionary analysis was conducted with the MEGA7 and MrBayes 3.2.6. programs. Initial trees for the heuristic search were obtained automatically by applying Neighbor-Joining and BioNJ algorithms to a matrix of pairwise distances estimated using a JTT model, and then selecting the topology with superior log likelihood value. The analysis involved (A) 27 and (B) 19 AA sequences. Numbers on branches represent the bootstrap value for ML analysis (black) and posterior probability value of BI analysis (red). The codes that appear next to the species in parentheses are the GenBank sequence accession numbers. Dashes (−) indicate disagreement between the ML and BI analysis. The scale bar corresponds to 10 (A) or 20 (B) substitutions per 100 AA positions.

