Fig. 3.
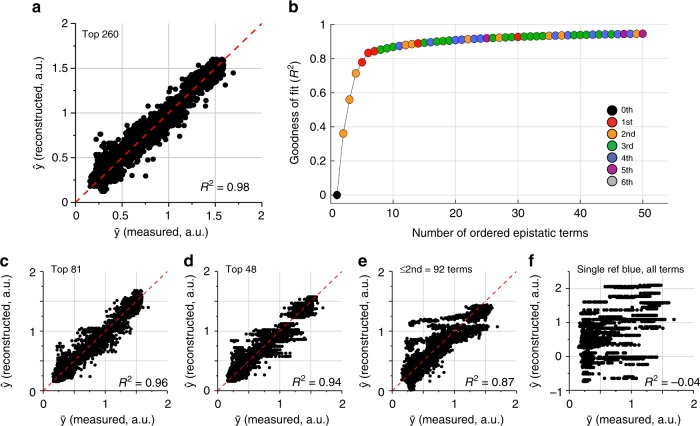
Sparsity in background-averaged (but not single-reference) epistasis. a reconstruction of all phenotypes from the 260 significant background averaged epistatic terms displays excellent agreement with measured data (goodness-of-fit R2 = 0.98, see “Methods”). b A plot of goodness-of-fit against number of included epistatic terms arranged by degree of contribution, indicating extraordinary sparsity in information content. Colors show the order of epistasis. c, d Consistent with sparsity, reconstruction of phenotypes with the top 81 (c) or top 48 (d) terms shows good agreement with measured data. e Reconstruction with only second order terms shows poorer agreement with data despite larger number of included terms, indicating the relevance of higher-order epistasis. f Single-reference epistasis shows no predictive power in reconstructing phenotypes, indicating lack of sparsity in this form of epistasis. Noise analysis for single reference epistasis for different genotypes as a reference yields highly variable numbers of significant terms. The plot shows the reconstruction for the parental blue genotype, for which we recover a mere 31 significant terms. Phenotypic reconstruction is poor and exhibits discrete levels due to the low number of epistatic terms

