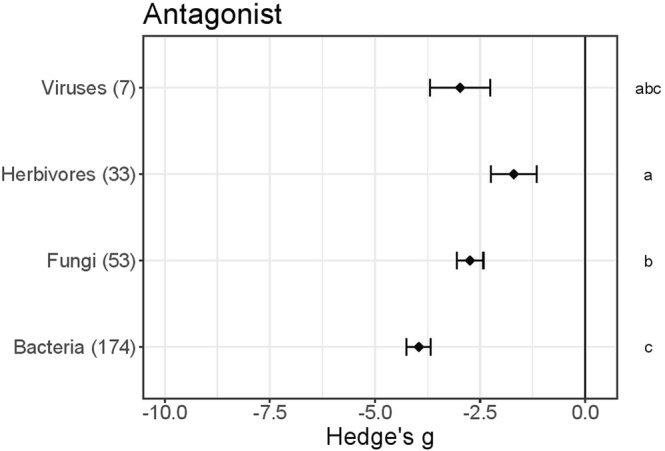
Figure 2.

Enhancement of primed Arabidopsis plants’ resistance to indicated antagonists (i.e. ASA in Table 1). Results of meta-analysis of data obtained from 267 experiments described in 77 publications. Hedge’s g indicates the treatment effect for each taxonomic group of antagonists, and negative values imply that primed plants were less damaged (or hosted less fit antagonists) than unprimed controls. Numbers of relevant experiments are shown in brackets, and symbols specify means of Hedge’s g ± SE bars. Different letters along the right-hand axis indicate significant differences according to the Kruskal Wallis test (α = 0.05) followed by Dunn’s test post-hoc test to rank differences (α 0.05).
