Figure 3.
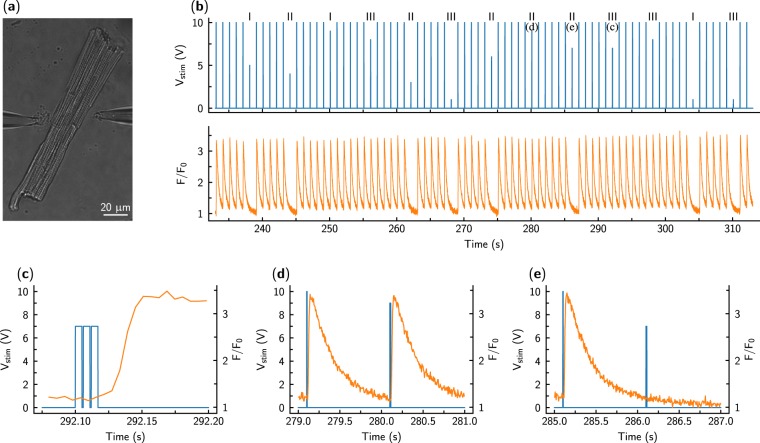
Response of a cardiomyocyte (a) to the stimulation by a sequence of pulses. The cardiomyocyte was excited by changes in voltage Vstim between the pipette tips applied as short rectangular pulses ((b), top). The pulse sequence consisted of 5 larger single pulses (pre-pulses, used to precondition the cell) followed by a studied stimulation sequence with varying pulse parameters. In (b) (top), changes in applied voltage are visible with the number of pulses per stimulation sequence marked as Roman numerals on the top of the trace. In response to the pulse, the cardiomyocyte was either stimulated or not. When stimulated, the fluorescence increase was somewhat delayed after the applied stimulation sequence (c), in agreement with the mechanism of Ca2+ -induced Ca2+ -release. Stimulation was assessed by recording fluorescence F of the Ca2+ sensitive dye and is shown normalized to the resting cellular fluorescence F0. Note that while the preconditioning pulses always elicited a Ca2+ transient, the success of cellular activation was variable for the studied pulses. As examples, stimulated (d) and non-stimulated (e) cases are shown with the preceding preconditioning pulse (see subplot markings at the top of the trace in (b) next to the corresponding pulse). In the figure, voltage and fluorescence traces are shown in blue and orange, respectively.

