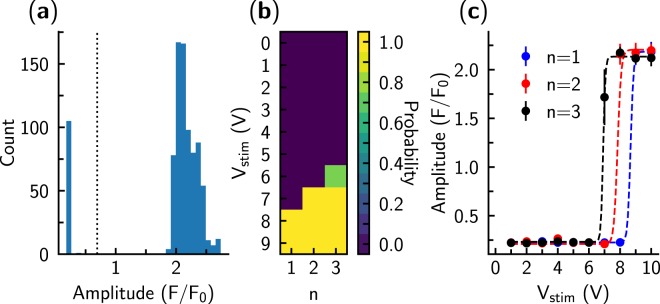
Figure 4.
Analysis of the recordings performed on a single cardiomyocyte. (a) Fluorescence changes during a single period were analyzed by following the amplitude of the changes. Note that the distribution of the amplitudes was bimodal: one population corresponded to cases with successful stimulation of the cell (larger F/F0) and one to unsuccessful stimulation (lower F/F0). The threshold value used for detection of cell stimulation by the given pulse is shown as a dashed line. (b) Average stimulation success rate for the pulses with different voltages Vstim and number of pulses n shown by color. Here, each pulse sequence was applied 5 times during the experiment. Note that for most of the pulse sequences the stimulation was either always or never successful (probabilities 0 and 1, respectively). However, for a triple pulse with Vstim = 6V, one of the 5 tests did not induce stimulation. (c) Threshold voltage for each of the pulse sequences was found by fitting the Hill equation to the average fluorescence amplitude when the fluorescence was studied as a function of the pulse voltage. Note that lower voltages were required to stimulate the cell if there were more pulses per each stimulation sequence (n). As an example, for this particular case, fitted values for n = 1 were A = 1.96, B = 0.22, V50 = 8.67, and h = 91.84. Here, the Hill equation is used only as a formal equation for description of transition from one state to another.

