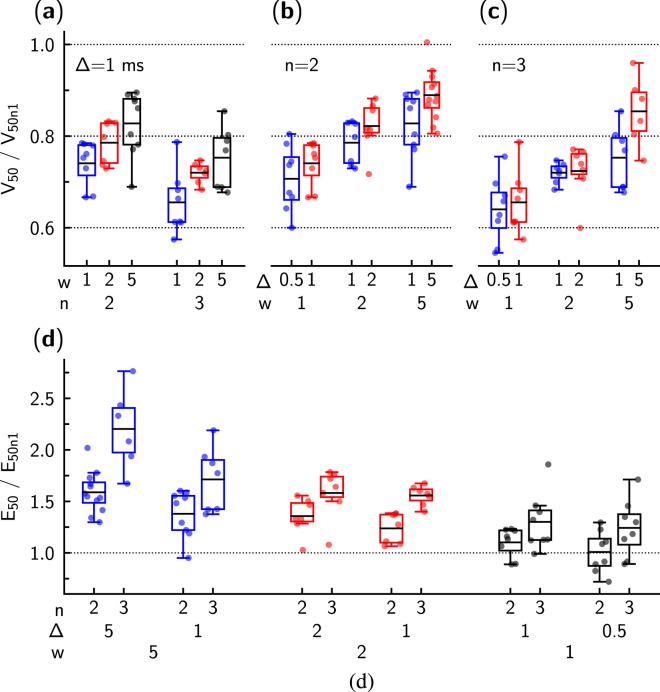
Figure 5.
Statistical analysis of the recorded data. Threshold voltage V50 and energy expenditure E50 obtained for the stimulation sequences with the multiple pulses (n = 2 or 3) were normalized to the respective values obtained for the same pulse width w (shown in ms) and inter-pulse interval Δ (shown in ms) for a single pulse stimulation (n = 1). (a–c) show threshold voltage V50 dependency on stimulation pulse width w, the number of pulses used in the sequence n, and the inter-pulse interval Δ. In (a), at the same interval Δ, the influence of pulse width w and the number of pulses n is demonstrated. In (b,c), note that multiple pulses with smaller w could lead to a significant reduction in the threshold voltage (V50/V50n1 < 1). In (d), energy expenditure E50 required to activate cardiomyocyte is shown for studied pulse sequences. For most of the sequences examined, E50 was larger when the cardiomyocyte was stimulated using multiple pulses (n > 1). An exception to this rule was the double pulse with w = 1 ms and Δ = 0.5 or 1 ms.

