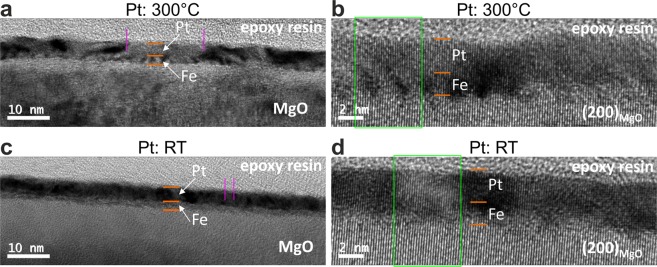
Figure 1.
Cross-sectional zero-loss energy filtered transmission electron microscopy images for two magnifications of the Fe (2 nm)/Pt (3 nm) bilayers on MgO (100), where the Fe layers are grown at 300 °C, but the Pt layers are grown at 300 °C (a,b) and room temperature (RT, c and), respectively. The dark-contrast regions correspond to the local nm-sized areas, being twisted relative to the MgO substrate. This twisting (small rotations or tilts) causes strong diffraction contrast. In (a,b), such twisted regions are noticeably fewer and more localized. This produces relatively large and weakly deformed (almost deformation-free) lateral regions (marked with vertical lines). In (c,d), the opposite situation occurs: the weakly deformed areas are laterally small and the strongly deformed regions dominate the bilayer within both individual layers. The high contrast between two individual layers in the RT-Pt sample is qualitatively similar to the one in the case of amorphous (or ideal polycrystalline) layers, where it is caused by a big difference in the atomic form-factor between Fe and Pt. It is a direct evidence for a deformed crystal growth of individual layers. The relatively weak contrast difference between the Fe layer and the single crystal MgO points to a good crystallographic adaption of the Fe layer to the substrate. Together with the previous statement, this implies that the Pt layer is the most laterally deformed one. On the other side, the loss of contrast difference between the Fe layer and Pt for the 300 °C-Pt sample reveals good epitaxial growth of the complete bilayer.

