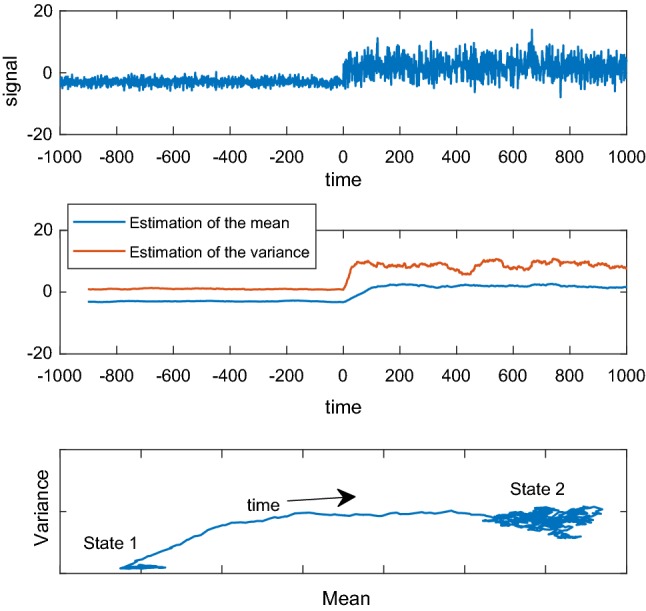
Fig. 1.

a A synthetic signal. The underlying statistical distribution changes in the middle. b The time series of the evolution of the estimation of the two statistical moments over time, when using a window of 50 time points. c The process viewed as a trajectory in the space of states. Each dimension of this space is the estimation of a statistical moment
