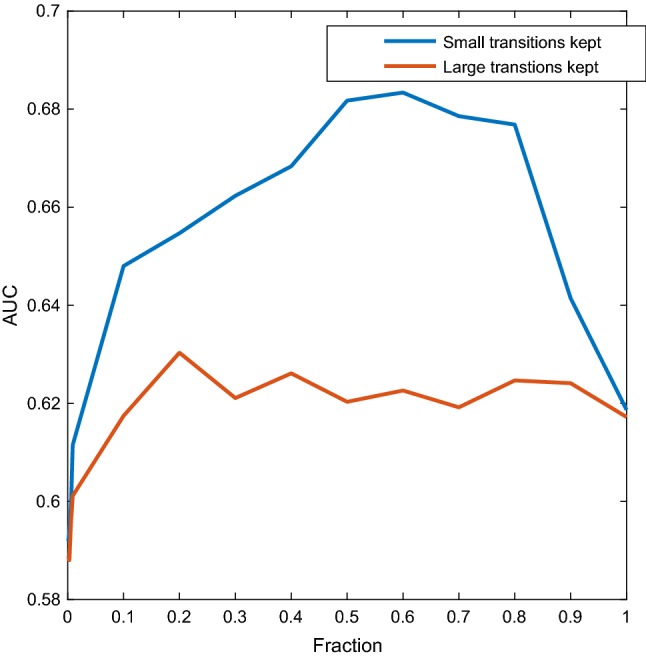
Fig. 3.

WM dataset using only upper beta and lower gamma ranges. The mean speeds of the CSSs were used as features. To compute the mean, the smallest (blue) and largest (red) F fraction of amplitudes were used. The classification performance is studied as a function of F. (Color figure online)
