
Figure 1.
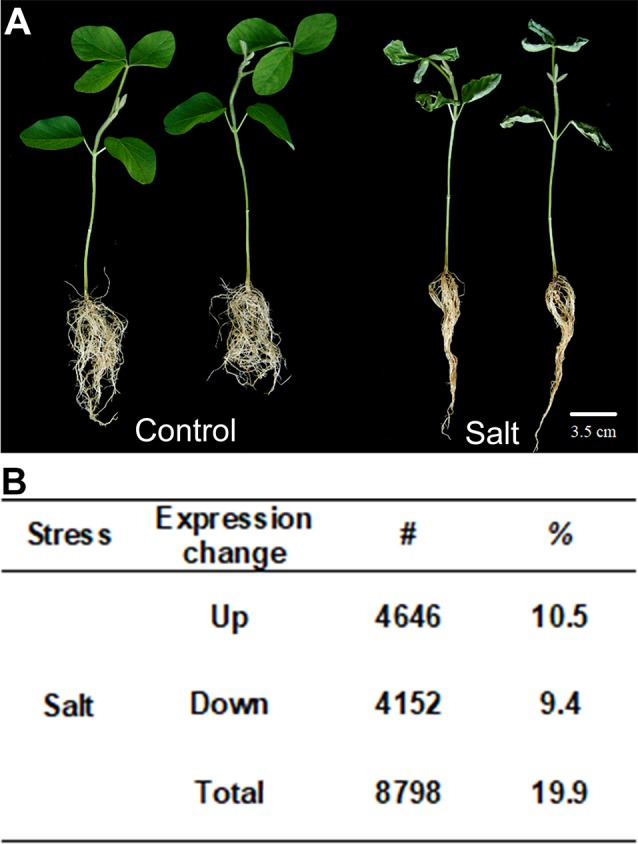
Soybean plants treated with salt stress and transcription profile analyzed by RNA-seq. (A) Salt treatment (100 mM of salt) on seedling of soybean (salt) and non-stressed control (control). (B) Gene expression changes in salt-treated soybean compared to control plants. Up means number and percentage (%) of genes up-regulated and Down means down-regulated relative to WT with p-value < 0.05. The total number of genes investigated is 44,346. Total indicates the total number of mis-regulated genes, i.e., total number of up- plus down-regulated genes. Bar = 2 cm.