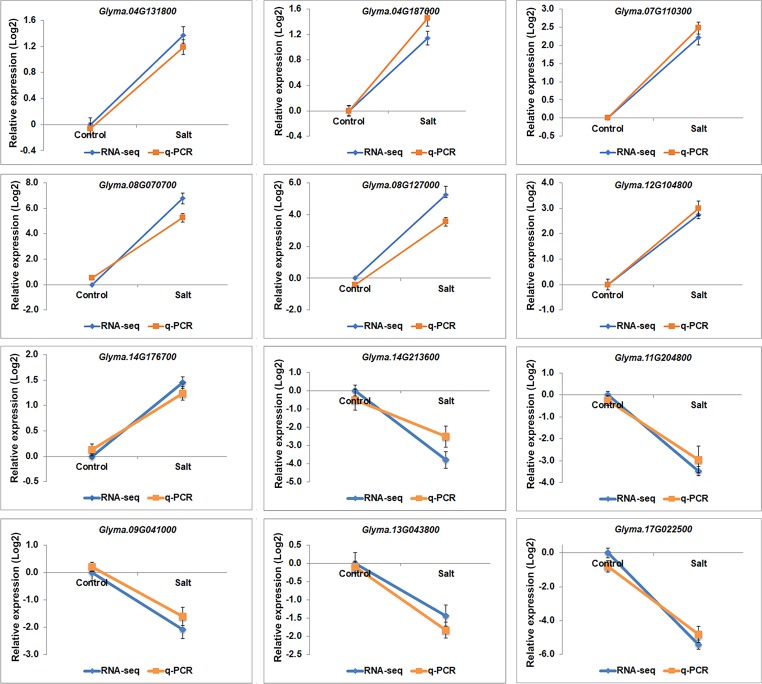
Figure 3.
The gene expression profile of selected salt stress genes analyzed by RNA-seq and q-PCR. mRNA expression levels of 12 selected salt stress genes with differential expression levels, Glyma.04G131800, Glyma.04G187000, Glyma.07G110300, Glyma.08G070700, Glyma.08G127000, Glyma.12G104800, Glyma.14G213600, Glyma.11G204800, Glyma.09G041000, Glyma.13G043800, Glyma.17g022500 and Glyma.14G176700, in control and salt-treated soybean. Graphs show the relative expression levels analyzed by RNA-seq and by qPCR which normalized to a Tubulin (Glyma.05G203800) reference gene. Error bars represent standard deviation (SD).

