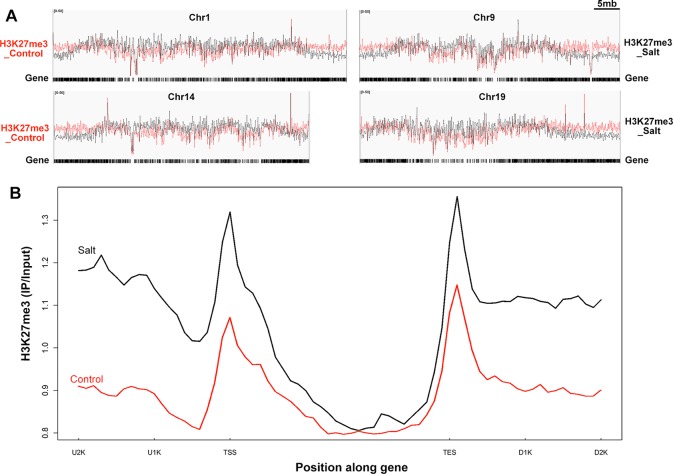
Figure 4.
Genome-wide H3K27me3 modification pattern in control and salt-treated soybean. (A) Chromosomal distribution of H3K27me3 modification sites on the randomly selected 4 soybean chromosomes. Y-axis represents the input signals for the immunoprecipitation of H3K27me3 in control on the left side (H3K27me3_Control) and salt-treated soybean on the right side (H3K27me3_Salt). The comparison of H3K27me3 marked in control (red) and salt (black) plants were shown on all chromosomes. Chr and 5mb represent chromosome and 5 megabase, respectively. Gene models shown at the bottom. (B)The H3K27me3 patterns of all trimethylated genes in control and salt-treated soybean. The gene sequences were aligned at the transcription start site (TSS) and average signals of the H3K27me3 enrichment 2kb upstream (U2K), 3kb gene body, and 2kb downstream of the TES (D2K) were plotted.

