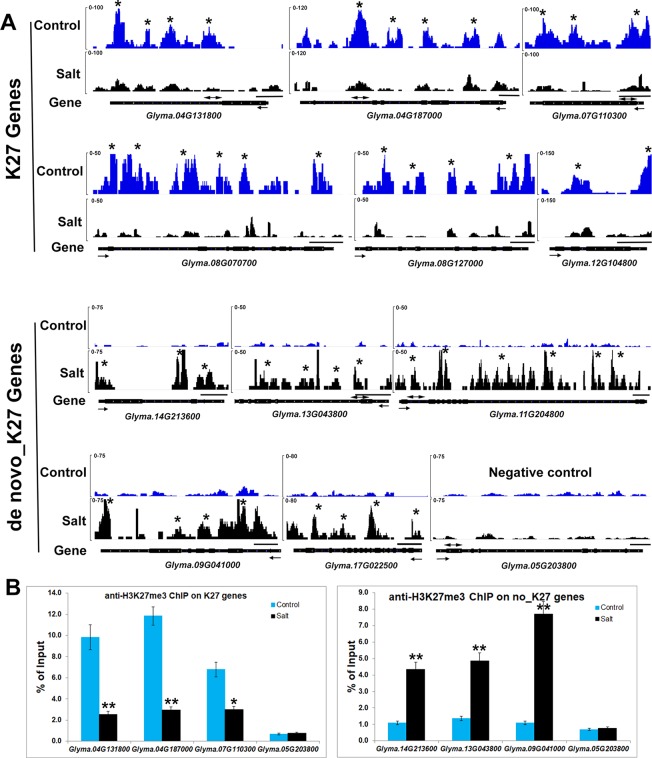
Figure 5.
Salt stress affects histone methylation at salt stress gene loci in soybean. (A) H3K27me3 patterns of K27 and de novo_K27 genes from ChIP-seq data in control and salt-treated soybeans. Gene models are shown at the bottom including 5’ UTR (medium black line), exon (black box), intron (thin black line) and 3’ UTR (medium black line). The arrow indicates transcriptional direction. The black line above gene model indicates 500bp. The “*” indicates that the MACS_peak with the statistical identification each sample using MACS with the default 10−5 p-value cutoff. (B) ChIP-qPCR analysis of H3K27me3 levels at the salt stress genes in soybean under salt stress by using Glyma.05G203800 (Tubulin) gene as the negative control. ChIP-qPCR results are expressed as a percentage of input DNA, with error bars representing SD. Primers (double arrowheads) correspond to the gene regions shown in (A). Significant differences from the control (Student’s t test) are marked with asterisks (**P <0.01).

